Chapter 6: Pharmacodynamics
2nd edition as of August 2022
Chapter Overview
Now that we have covered what the body does to the drug, it is time to examine what the drug does to the body. As you may recall, pharmacodynamics is the study of the actions and effects of drugs on the body. Throughout this chapter, we will explore the different ways in which drugs bring about their effects and how we can compare the effects of different doses of drugs. Before starting, it may be useful to review the contents of Chapter 4, as neurotransmission plays a large role in how drugs work.
Chapter Outline
6.1. Mechanisms of Drug Action
- 6.1.1. Altering Neurotransmission
- 6.1.2. Direct Agonists and Antagonists
- 6.1.3. Indirect Agonists and Antagonists
- 6.1.4. Drug Interactions
- 6.2.1. The Relationship Between Dose and Effect
- 6.2.2. Analyzing Dose-Response Curves
- 6.2.3. Measuring Drug Safety
Chapter Learning Outcomes
- Define pharmacodynamics.
- Clarify how drugs alter neurotransmission.
- Contrast direct and indirect agonists and antagonists.
- Clarify the relationship between dose and effect.
- List and describe key values of note on dose-response curves.
- Explain how we measure drug safety.
6.1. Mechanisms of Drug Action
Section Learning Objectives
- Differentiate between the different types of receptors and explain their roles in neurotransmission.
- Explain the different ways in which drugs can influence neurotransmission and define all relevant terms.
- Distinguish between the three different types of drug interaction and describe potential causes.
Pharmacodynamics in its simplest form asks, “How do drugs do what they do?” We have touched on this topic before in previous chapters. As stated before, drugs cannot make the body do anything that the body doesn’t normally do. All they do is change the rate of pre-existing physiological processes. The rate of physiological processes is controlled by the rate of neurotransmission. Drugs can alter physiological function by altering the rate of transmission so that there is increased or decreased activation of receptors that regulate that function. Consciousness, for example, is determined by neurotransmission in the ascending reticular activating system (ARAS). Stimulant drugs such as amphetamine increase alertness and wakefulness by enhancing transmission of specific transmitters, whereas depressant drugs such as alcohol bring on sedation by altering the activity of certain neurotransmitters. Peripherally, heart rate is regulated by the activity of the autonomic nervous system. Drugs can stimulate heart rate by increasing the activation of adrenergic receptors that stimulate cardiac activity, while other drugs alter cholinergic transmission to inhibit cardiac activity. Understanding what a drug does means knowing where and how a drug affects neurotransmission.
6.1.1. Altering Neurotransmission
First, it is necessary to pinpoint exactly what is changing when a drug alters neurotransmission. Across all drugs, the ultimate change is the degree of postsynaptic receptor activation which, in turn, alters the rate of the physiological process. Remember that postsynaptic receptors are the receptors on the receiving end of the synapse. When these receptors are activated, they open or close ion channels in the postsynaptic neuron, giving rise to excitatory postsynaptic potentials (EPSPs) or inhibitory postsynaptic potentials (IPSPs). This makes it more or less likely to trigger an action potential. All this information was covered in chapters 3 and 4 and should already be familiar to you.
Drugs can affect postsynaptic receptors by binding to them directly, but they can also bind to presynaptic receptors to influence neurotransmission by altering how much transmitter is released. We will look at both direct and indirect methods, starting with the former. Presynaptic receptors modulate the production and/or release of the transmitter. These receptors can be classified as one of two types, autoreceptors, and heteroreceptors.
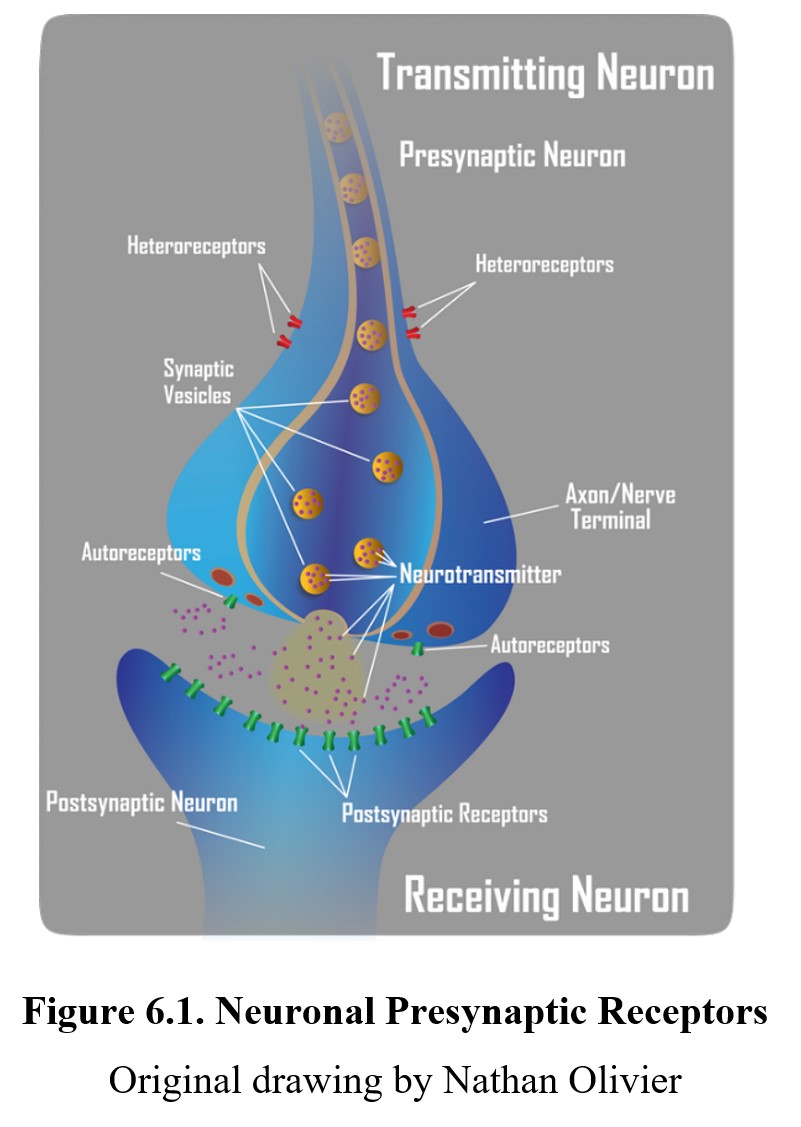
Autoreceptors represent one mechanism whereby neurons self-regulate their level of activity. The presence of autoreceptors answers the question, how do nerve terminals know how much neurotransmitter to release into the synapse? They serve as a negative feedback loop—the amount of neurotransmitter released into the synapse can regulate its own release by activating inhibitory autoreceptors, which tells the neuron to stop releasing the neurotransmitter. Autoreceptors are generally located on the presynaptic neuronal mechanism close to where neurotransmitters are released. On the other hand, heteroreceptors are activated by transmitters released from other neurons that regulate the activity of the presynaptic neuron. Activation of presynaptic heteroreceptors can either increase or decrease the release of neurotransmitters from the presynaptic neuron, thus influencing synaptic transmission. The hetero- prefix means “different”. What distinguishes an autoreceptor from a heteroreceptor is the source of the neurotransmitter that activates the receptor. In some cases, the primary neuron and the other neuron may use the same neurotransmitter. But if it originates from the primary neuron, it acts on presynaptic autoreceptors. Conversely, if it originates from the other neuron, it acts on presynaptic heteroreceptors. Heteroreceptors can be located anywhere on the transmitting neurons, in the dendrites, soma, or axon.
6.1.2. Direct Agonists and Antagonists
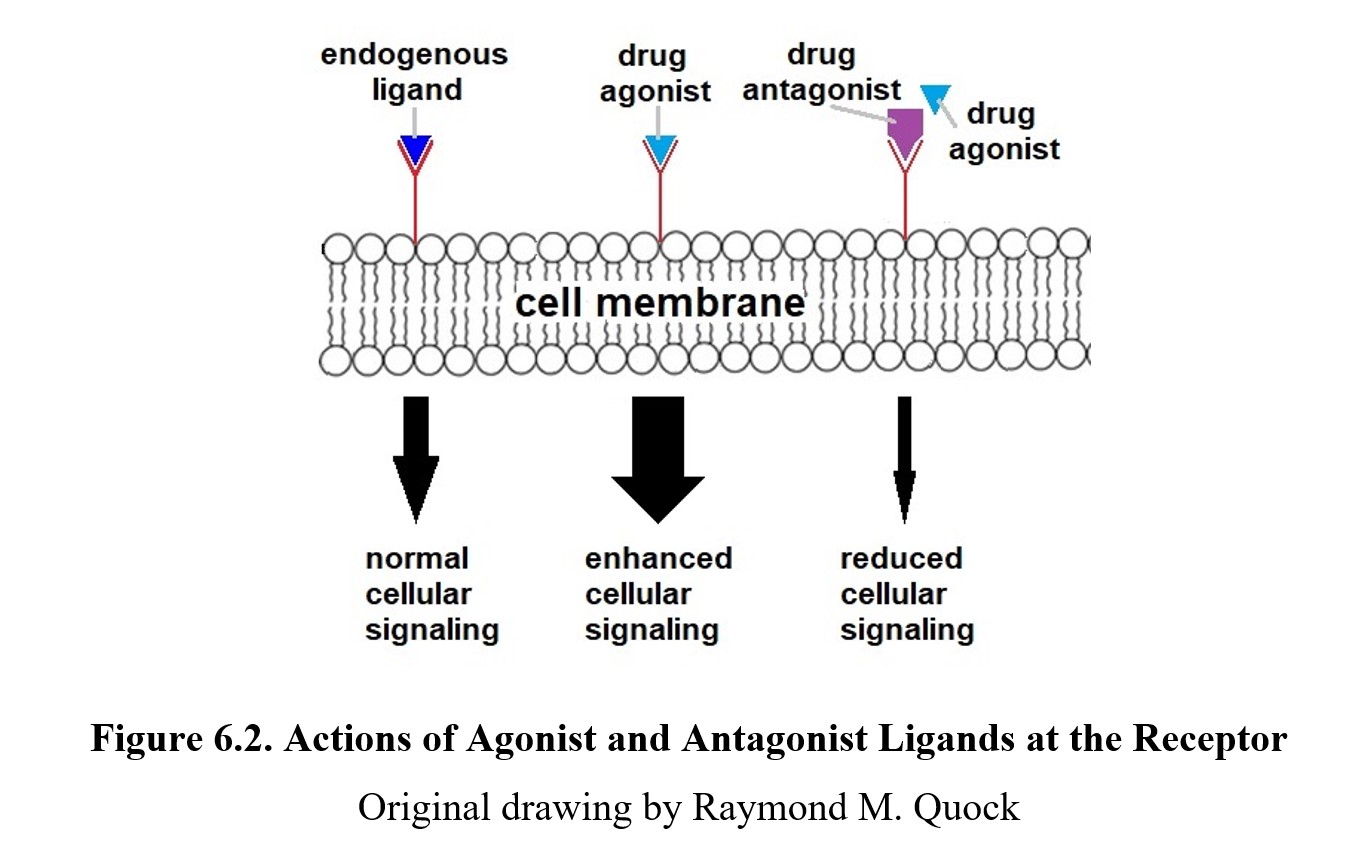
Remember that a ligand is anything that can specifically bind to a given receptor. Some ligands are endogenous ligands such as neurotransmitters and hormones. Other ligands are exogenous ligands that originate from outside the body such as products from plants or pharmaceuticals produced by a drug company. Some endogenous and exogenous ligands can bind to postsynaptic receptors and directly increase or decrease receptor activation. These drugs are called agonists, which possess both affinity and efficacy for the receptor. Some agonists are more effective than others because they are full agonists and possess a higher degree of efficacy. On the other hand, if a drug has reduced efficacy, it is called a partial agonist. An example of a full agonist would be morphine which activates opioid receptors. An example of a partial agonist would be buprenorphine, which activates the same receptors as morphine but with reduced efficacy so buprenorphine produces weaker effects than morphine.
By comparison, an antagonist (the ant- prefix is the same as anti-, meaning “against”) has affinity for the receptor but no efficacy; it will bind to the receptor but not activate it. This reduces the number of receptors available to be activated, thus decreasing the effect of the neurotransmitter. Because antagonists lack efficacy, they will not produce an effect on their own. But what they do accomplish is to deny the receptor to an agonist ligand. Because of how they work, receptor antagonists are also called receptor blockers. See the image below to compare agonist and antagonist drugs:
Antagonists can be either competitive or noncompetitive. A competitive antagonist binds to the same active site as the neurotransmitter. Thus, an antagonistic drug will compete for the same active site as an agonistic neurotransmitter. It is possible to increase the amount of neurotransmitter and “crowd out” or surmount the blockade of the receptor by the antagonist, restoring the drug effect. A noncompetitive antagonist avoids this overriding effect by binding to the active site irreversibly or by binding to a site on the receptor that is different from the active site and preventing activation of the receptor. In these cases, increasing the amount of agonist will not outcompete the antagonist or overcome the noncompetitive blockade of the receptor.
Agonists and Antagonists [5:12]
(N.B. View up to 3:22 only; what follows 3:22 is chemical and
physiological antagonism, which are less relevant in this course.)
Many receptors have a baseline or basal level of activity. Agonists enhance this, while antagonists keep the activity at or below the baseline, depending on whether there is tonic stimulation of the receptor. However, some drugs can induce exactly the opposite effects mediated by the receptor and are called inverse agonists. Many drugs previously classified as antagonists are being relabeled as inverse agonists because we have learned that they impede the resting activity of receptors. One such example would be those drugs called benzodiazepine inverse agonists because, in contrast to benzodiazepine agonists that cause anxiolytic and anticonvulsant effects, inverse agonists induce anxiety and convulsions.
One final term you should familiarize yourself with is allosterism. An allosteric modulator is a drug or ligand that alters receptor activity by binding to a site other than the active site (i.e., the one that an endogenous agonist normally would bind to). This is done by changing the conformation (shape) of the receptor protein (from allos in Greek for “other” and stereos for “solid.”). Some non-competitive antagonists (negative modulators) are allosteric as mentioned above. Allosteric modulators can also increase agonist affinity or efficacy (positive modulators). We will encounter this mechanism when we cover caffeine and benzodiazepines in subsequent chapters.
6.1.3. Indirect Agonists and Antagonists
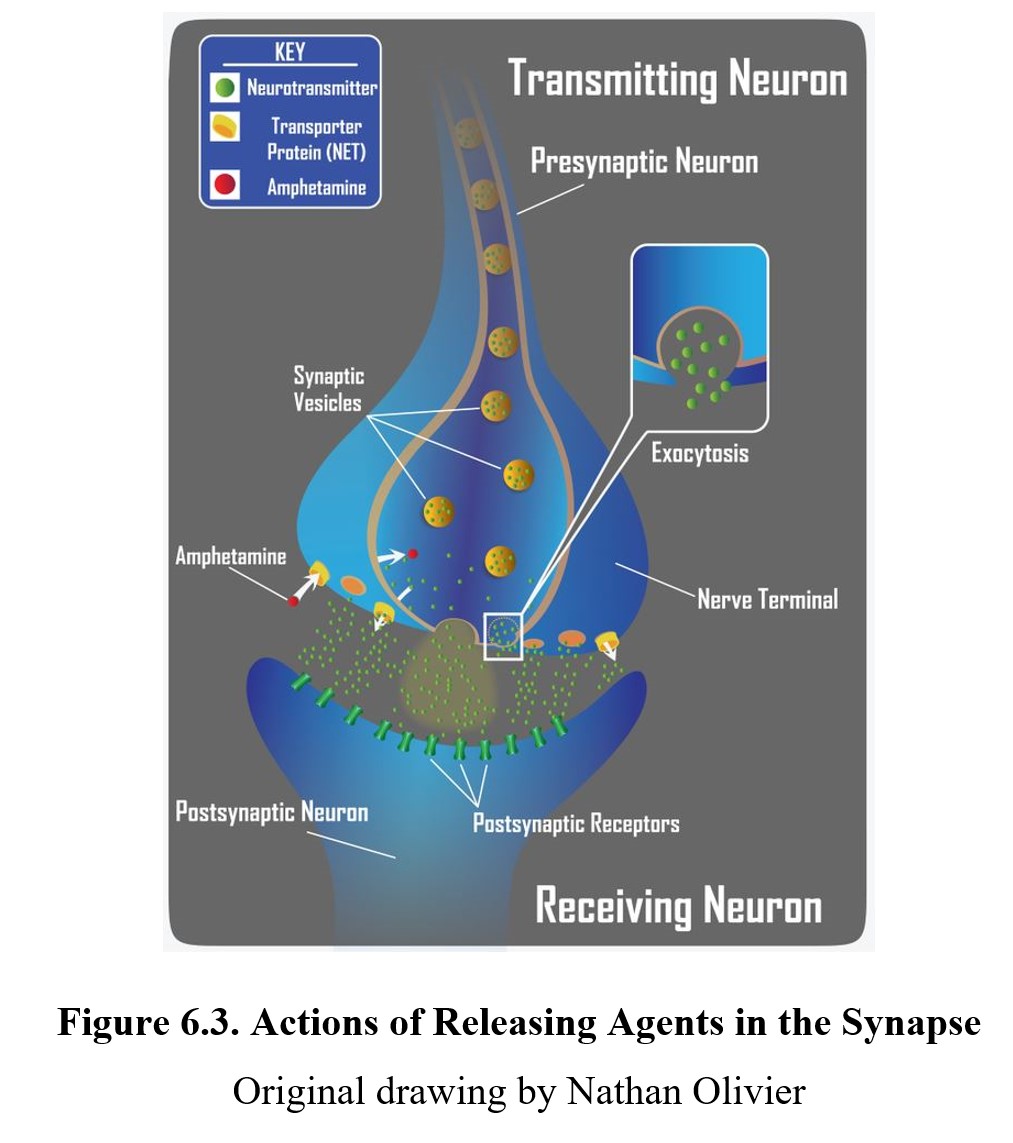
As we mentioned before, the site of action of a drug need not be limited to the postsynaptic receptor although ultimately the degree of activation of the postsynaptic receptor may be affected. Some drugs can influence neurotransmission at different steps in the process. An indirect agonist is a drug that enhances receptor activity without directly binding to the receptor. One way to accomplish this is to induce the release of a neurotransmitter either directly or activate an excitatory heteroreceptor on the presynaptic neuron. The result would be an enhanced release of transmitters with increased activation of postsynaptic receptors. Amphetamine is such an example of an indirect agonist that is a releasing agent. Releasing agents may or may not possess agonist activity at postsynaptic receptors, but their main effect comes from increased transmitter release.
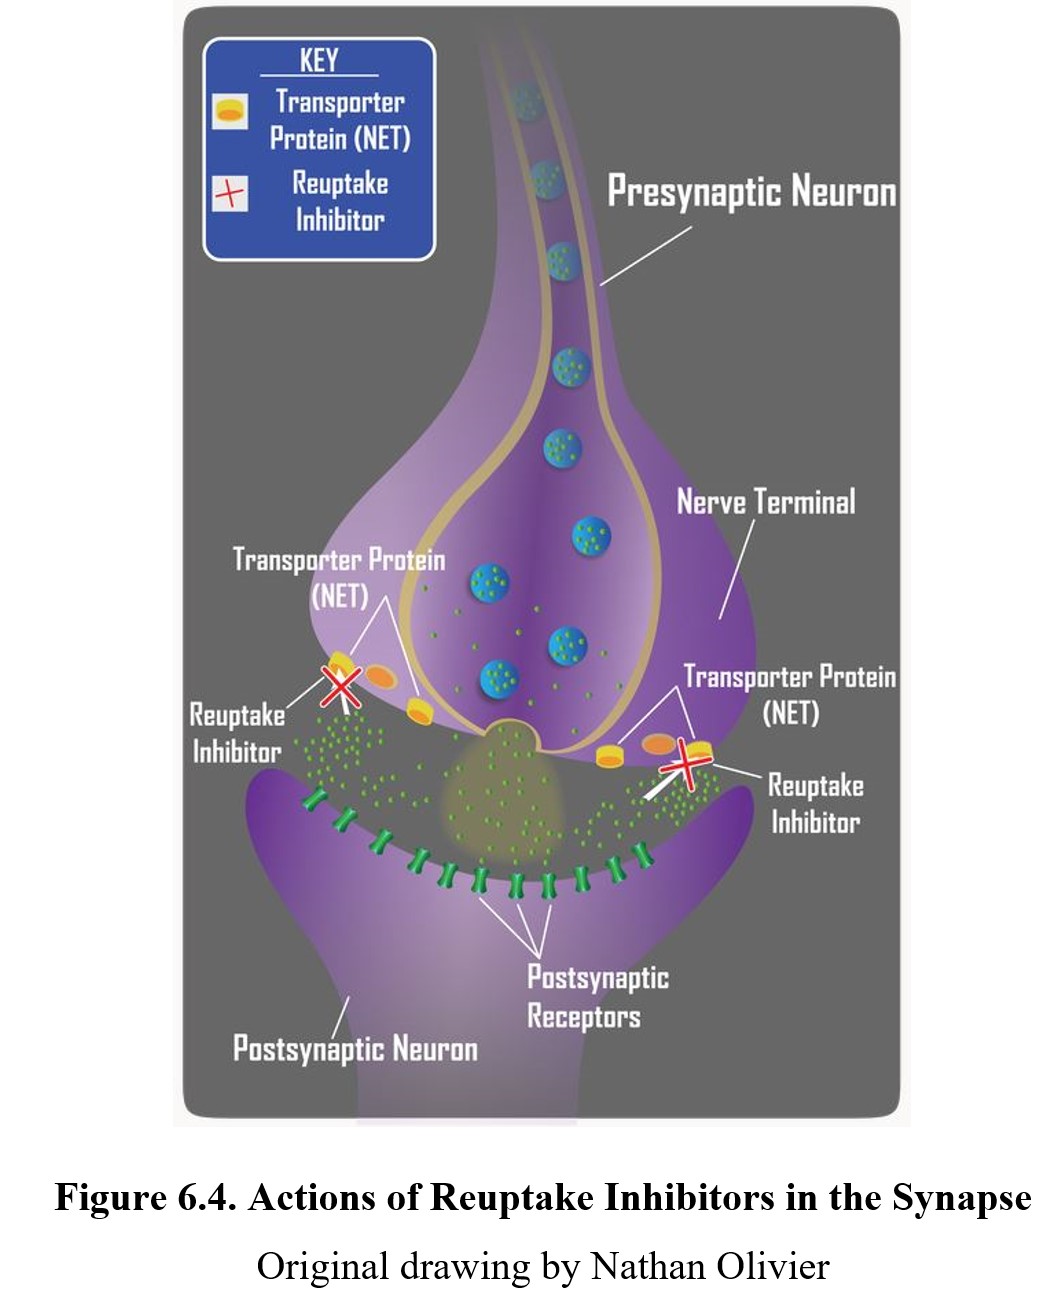
Another common mechanism of indirect agonism is to increase the amount of neurotransmitter in the synaptic cleft by blocking the mechanisms meant to remove them. The way in which the actions of most neurotransmitters are terminated is through a process called neuronal reuptake. A reuptake inhibitor accomplishes this is by blocking the transporter proteins in the neuronal membrane that are responsible for reclaiming the neurotransmitter from the synaptic cleft. This increases the amount of neurotransmitter available to activate postsynaptic receptors (see image below). Cocaine was the first drug found to block transporter proteins and prevent neuronal reuptake of transmitters.
Reuptake inhibitors are a common type of drug and can be found in many therapeutic medications, such as selective serotonin reuptake inhibitors (SSRIs) or serotonin- norepinephrine reuptake inhibitors (SNRIs). We will cover these in greater detail when we discuss antidepressants in Chapter 16.
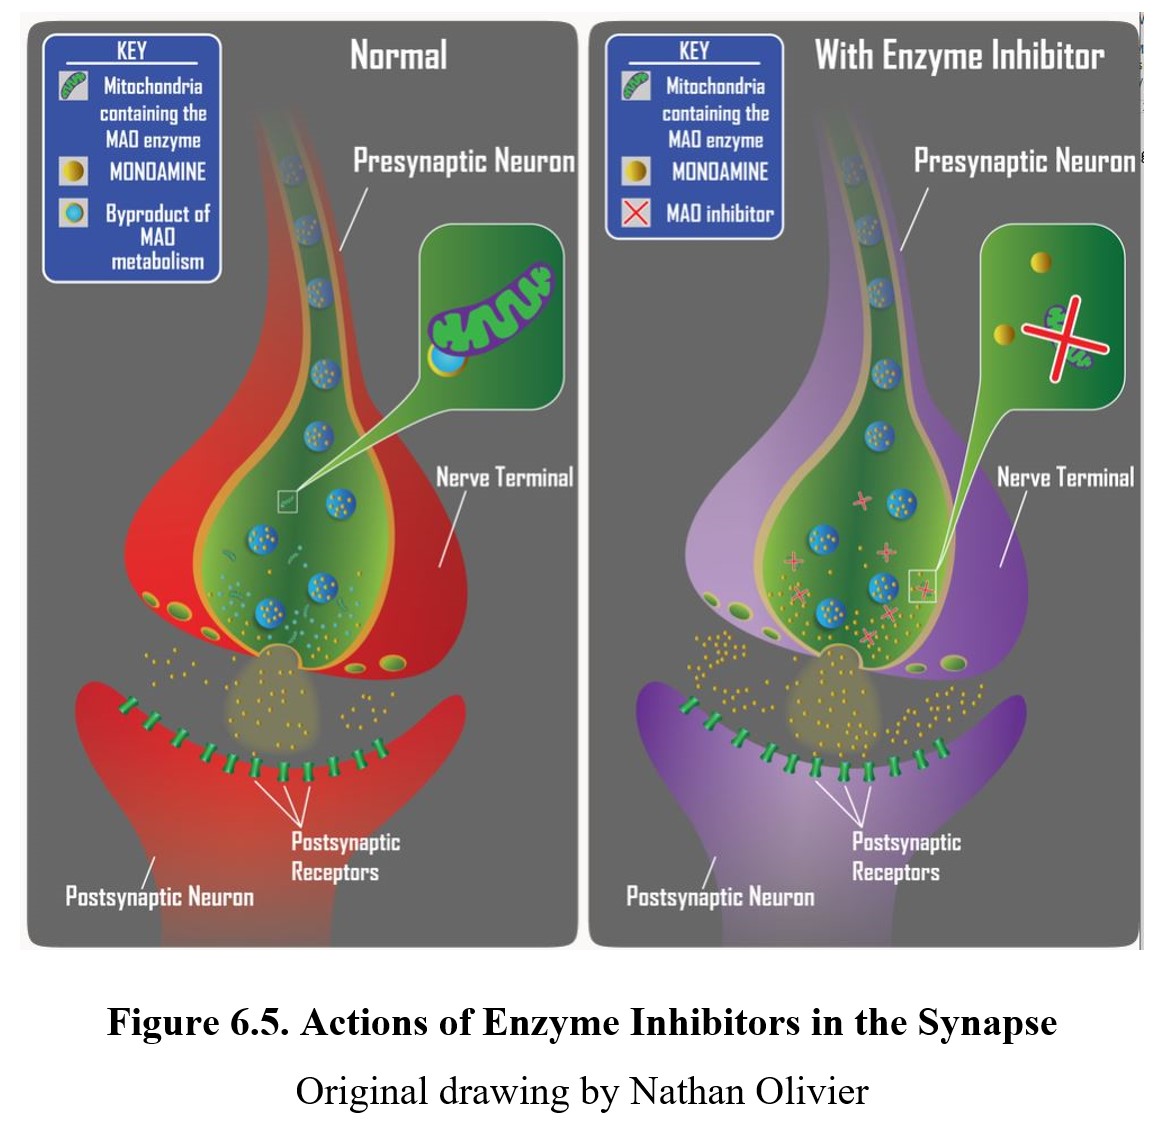
If the neurotransmitter is normally broken down by enzymes within the synaptic cleft or after reuptake, an enzyme inhibitor can interfere with this process by inhibiting the enzymes responsible. The result is similar to reuptake inhibitors; by preventing the breakdown of the released neurotransmitter, the amount available to activate receptors increases. An example is the monoamine oxidase inhibitor (MAOI) used to treat some forms of depression by preventing monoamine oxidase (MAO) from breaking down monoamine neurotransmitters and increasing the amount of transmitter in the synapse (see diagram below).
The following video focuses on indirect-acting and mixed-action agonists. Amphetamine and cocaine are indirect-acting agonists because they do not interact directly with the postsynaptic receptor but cause activation of these receptors. Mixed-action agonists include ephedrine and pseudoephedrine, which can induce neuronal release of transmitter and have a secondary direct action on beta-adrenergic receptors.
Indirect-Acting Adrenergic Agonists [5:11]
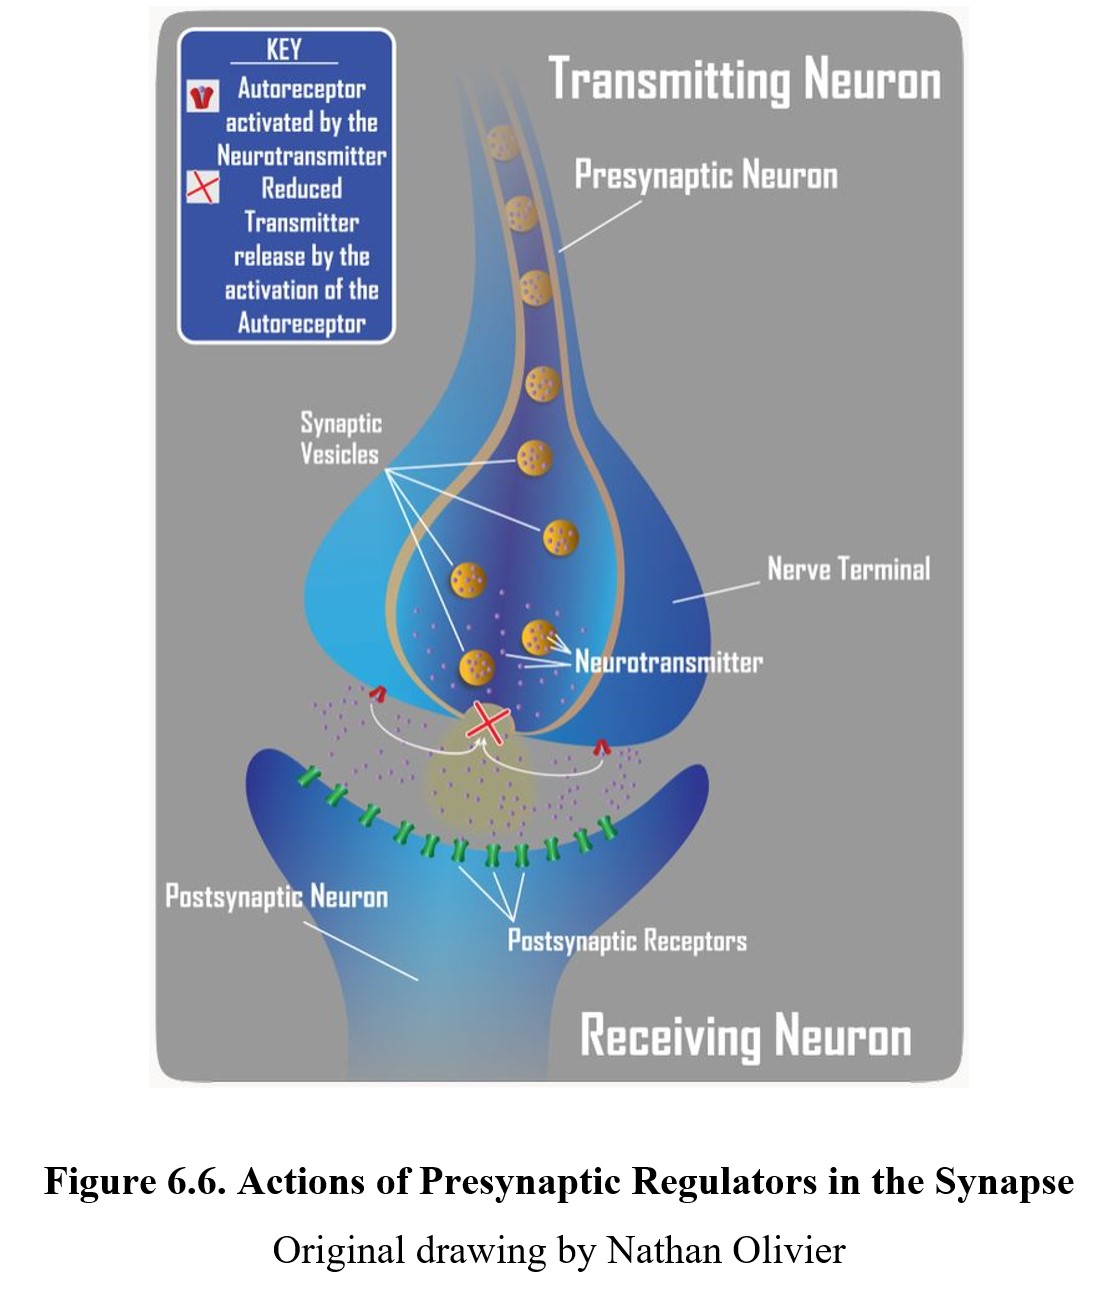
It is also possible to have indirect antagonistic effects. By inhibiting the release of neurotransmitters, a drug can indirectly reduce overall receptor activity by decreasing the quantity of neurotransmitter in the synapse. A presynaptic regulator binds to the autoreceptors on the presynaptic neuron and inhibits neurotransmitter release (see diagram below).
Ultimately, drugs can target any step in the neurotransmission process. What is important to remember is that the response to a drug is defined by the ultimate effect it has on the level of target receptor activation. Of course, many ligands act at multiple receptors. Part of the difficulty in developing a new drug has to do with finding a more selective compound that acts at the desired site without activating other receptors and triggering adverse side effects.
6.1.4. Drug Interactions
The effects of a drug can also be influenced by the presence of other drugs or substances. Drug interactions can result in the enhancement or reduction of a drug’s effect. When two drugs with similar effects are used together, the result can be additive, meaning the total response is what you would expect if you added the independent effects of the drugs together. For example, Drug A = 1, Drug B = 1, Drug A + Drug B = 2. A synergistic interaction, meanwhile, is greater than you would expect—the two drugs interact in a way that multiplies their effect. For instance, Drug A = 2, Drug B + 4, Drug A + Drug B = 10. An example is the synergistic effect of multiple drugs that depress neuronal activity such as ethanol plus a sedative drug. Potentiation occurs when one drug has minimal effect by itself but enhances the effects of a second drug. Finally, if a drug reduces the effectiveness of another, this is considered antagonism.
Drugs Interaction: Additive, Permissive, Synergistic, Tachyphylactic [1:50]
(N.B. A more common name for permissive is potentiating.
Tachyphylactic is another name for acute tolerance.)
The causes of drug interactions are numerous. We covered many possible causes in the previous chapter on pharmacokinetics. Competition for plasma protein binding sites is one such cause, as this can change the bioavailability of the drug. Other drugs or substances that alter drug metabolism can likewise influence how much a drug is delivered to its target receptors.
Drugs can also interact in a pharmacodynamic manner by competing for certain receptors or pathways. Usually, this is unintended and can result in severe consequences, but there are cases where this is desirable. Naloxone, a competitive opioid antagonist, is administered in the case of an opioid overdose because it has an antagonistic interaction with other opioids. By blocking opioid receptors, the effects of opioid overdose (most importantly, life-threatening respiratory failure) can be reversed.
6.2. Evaluating Drug Effects
Section Learning Objectives
- Describe dose-response curves and explain how they can be used to compare drugs.
- Explain how dose-response curves can be used to measure drug safety.
- Differentiate between therapeutic and certain safety indices.
Once you know where a drug acts, it is necessary to evaluate the drug’s effect. Does it produce a strong response? How much drug is needed? As the amount of drug changes, how does the response to the drug change? And most importantly, is the drug safe to use? To answer these questions, pharmacodynamics provides a set of tools to evaluate and compare the effects of drugs. In the second half of this chapter, we will learn about these tools and how to use them.
6.2.1. The Relationship Between Dose and Effect
In pharmacology, it is important to know how strong the response will be for a given dose. If we administer 1.0 mg of Drug X, how much effect will it produce? What about 5.0 mg, 10 mg or 100 mg? In reality, what we are interested in is what the effect of a drug will be at any dose and how that effect changes. This will allow us to select the proper dosage for the drug and determine whether this drug is safe and useful.
By taking measurements at a few key points (and understanding the mechanism of action), it is possible to produce a graph showing the relationship between dose and effect by measuring the intensity of effects across a range of doses. This graph is called a dose-response curve or a dose-effect curve. You can see an example below:
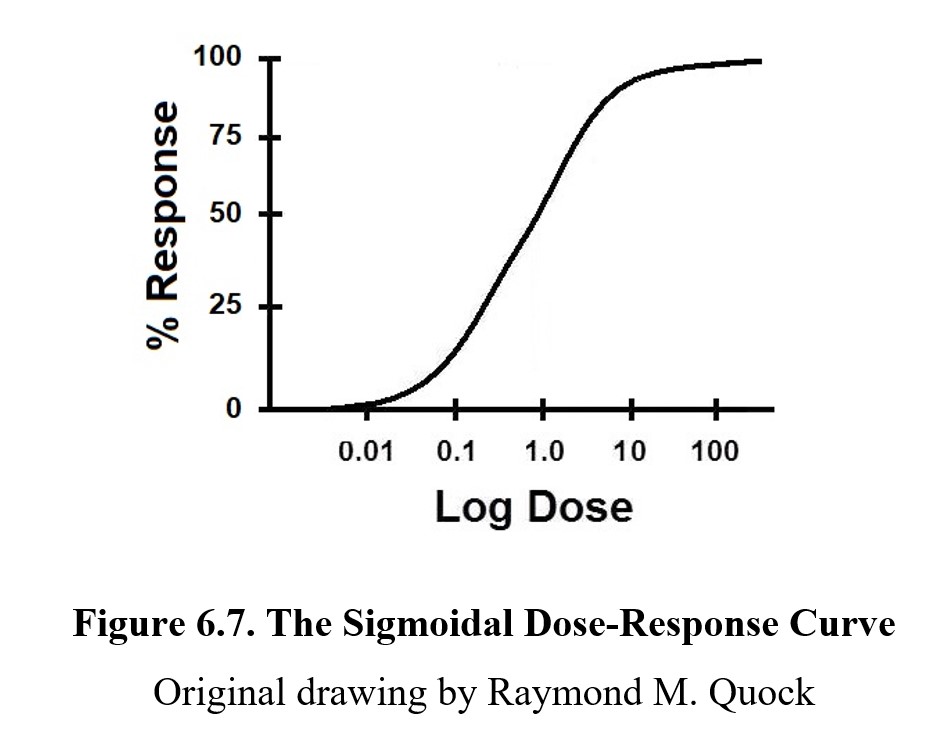
On a dose-response curve, the magnitude of the drug effect or response is plotted on the y-axis; this ranges from 0% (no effect) to 100% (maximum possible effect). The dose range of the drug is represented on the x-axis. Because we want to see a wide range of doses, we plot them in a logarithmic or log scale to compress the graph; note how the intervals do not go 1, 2, 3, 4, 5, but rather 0.01, 0.1, 1.0, 10, 100. (The graph is called a semi-log graph because only one axis is in a log scale.)
In a semi-log dose-response curve, most drugs produce a graph shaped like the one above. The S-shaped curve is called a sigmoidal curve, from the Greek letter sigma (S). It is important to recognize that the S-shape is a result of the log scale used on the x-axis. If we were to plot the graph linearly, you would see the steepest part at the lowest values, while the slope would gradually decrease. When the dose is very small, a small change can cause a large increase in activity because all of the drug is being used. At very high concentrations though, increasing the dose has diminishing returns since the target site is already saturated in the drug. Without the dose scale in log, the shape of the curve would be hyperbolic.
Not all dose-response curves are sigmoidal. Some curves are biphasic, meaning the greatest effect occurs at a moderate dose. Alcohol is one such example. Small amounts provide a stimulating effect (a “buzz”), but indulgence causes a depressive effect. (The term biphasic means “two phases.”) We will return to this when we cover alcohol in Chapter 11, but we will stick to sigmoidal curves for the examples in this chapter as they are the most common.
6.2.2. Analyzing Dose-Response Curves
On every dose-response curve, there are a few key values of note. Take a look at the graph below:
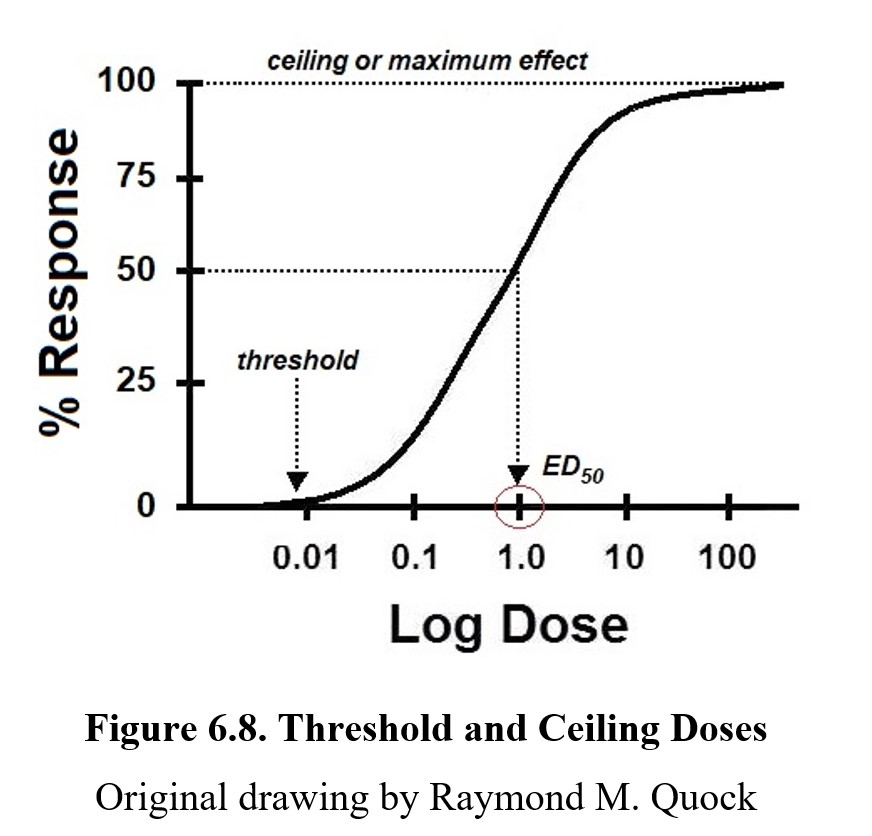
The threshold dose is the lowest dose that produces any measurable response. Doses beneath the threshold will cause no effect. Increasing the dose eventually crosses the threshold and what ensues is a dose-related increase in the % response. Once the curve levels off, it reaches its maximum response, also called maximum effect or ceiling response/effect. Increasing the dose beyond this point will not increase the effect of the drug. It is also important to note that the ceiling for a drug is not always at 100%. Not all drugs have the same maximum effect; some drugs are only capable of producing a partial response at most. In this case, the ceiling would be lower. (We will revisit this shortly.) The dose that produces half of the maximum response would be the median effective concentration commonly referred to as the effective concentration, 50% (EC50) or effective dose, 50% (ED50). The 50% is the dose that produces half of the maximum response. If the drug has a maximum response of 80%, an ED50 dose would produce a 40% response.
ED50 values are common reference points when comparing different drugs. One way in which drugs can differ is in terms of potency. The potency of a drug is defined as the dose required to produce a response of a given intensity. The more potent a drug is, the lower the dose required to produce an effect. Examine the example below:
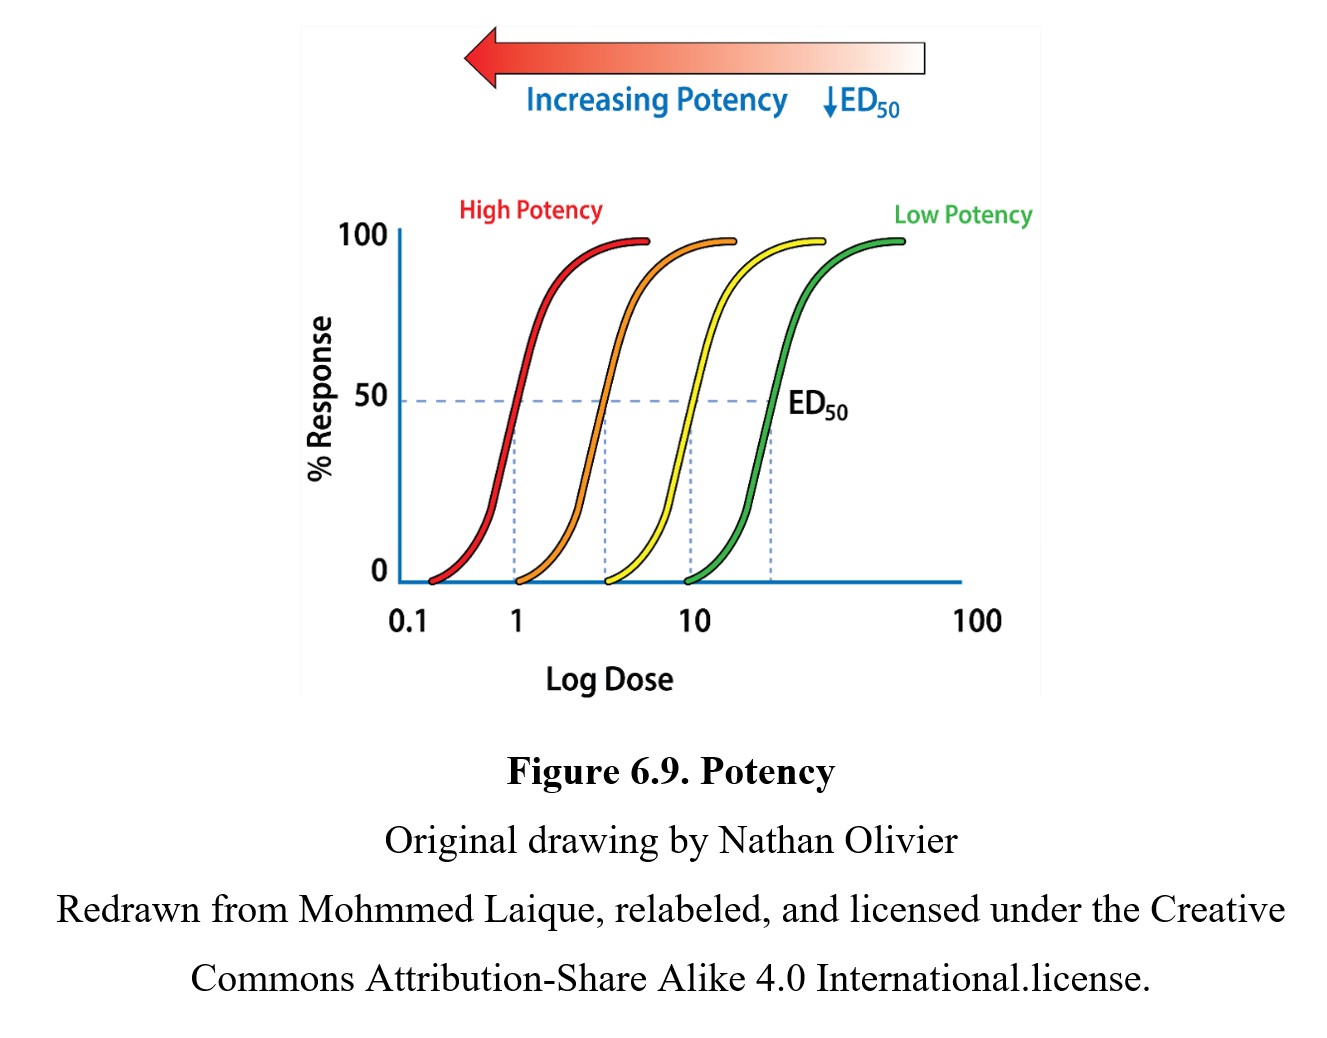
As you can see, drugs with curves that are closer to the left side of the graph are more potent than those further to the right. You can also see that each drug has the same maximum response and EC50, but the more potent drugs reach these values at lower doses.
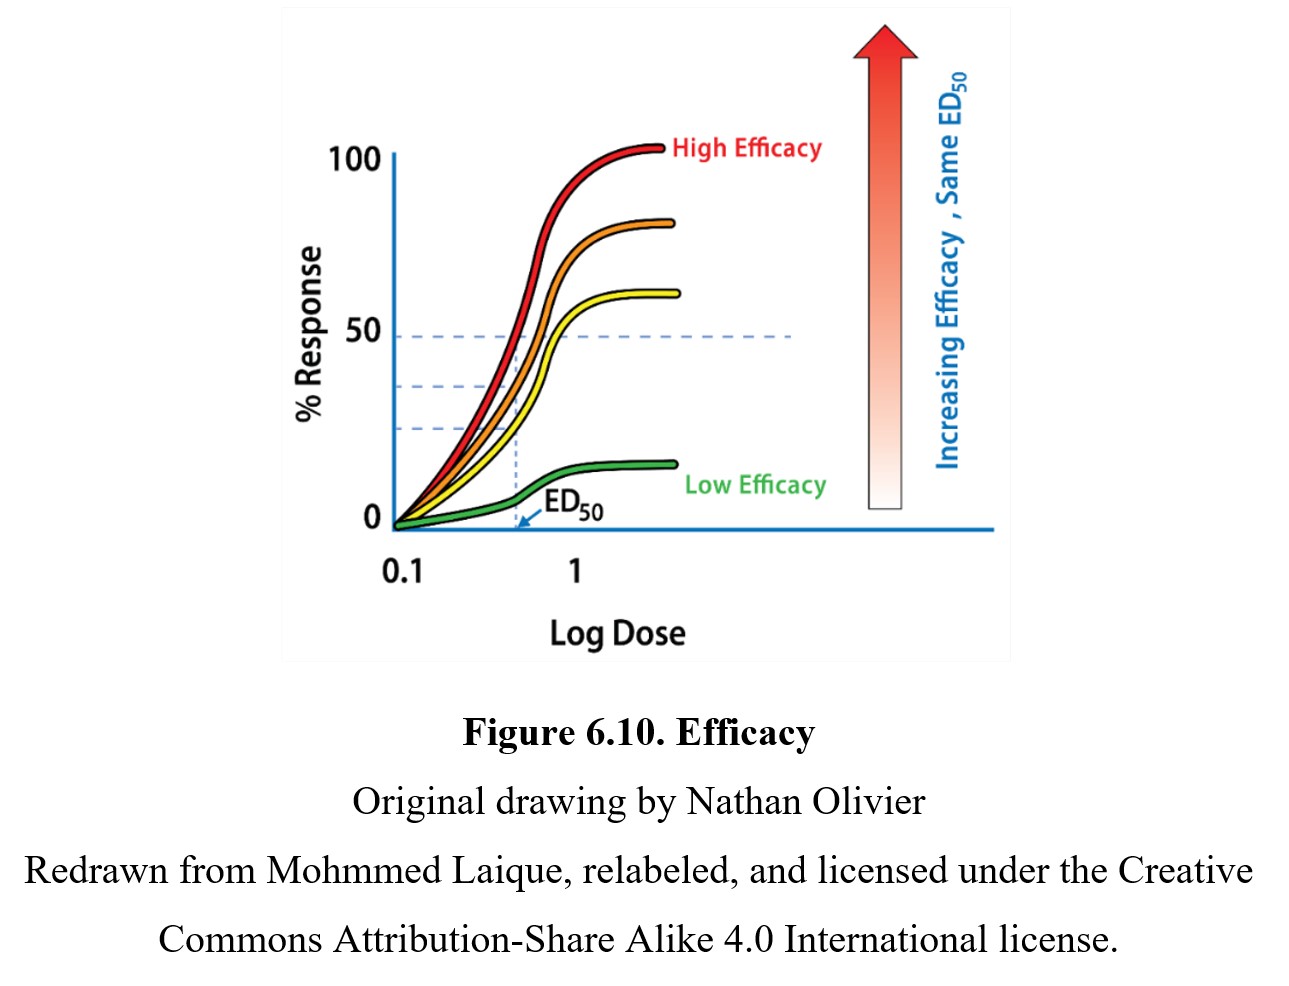
In comparison, the efficacy of a drug is determined by the maximum response produced by the drug. As mentioned previously, not every drug can reach a 100% response. A drug with a lower efficacy (such as a partial agonist) has a reduced maximum response and EC50, which flattens the sigmoidal curve. You can see this in the graph below showing four drugs with the same potency but different efficacies:
Finally, it is worth noting the slope of the dose-response curve. The effects of a drug with a steep slope are more sensitive to small changes in dose. Another way of thinking about it is that the threshold and maximum response doses are closer together on a steep graph compared to a shallow one. Although most research will focus on the potency or efficacy of a drug, the slope of the dose-response curve is another important factor that has implications for the relative safety of different drugs.
6.2.3. Measuring Drug Safety
How exactly do we determine whether a drug is safe? If comparing two drugs, how do we determine which drug is safer? Part of the issue is that not everyone responds to the same drug in the same way. To reflect on this, it is common to construct a slightly different dose-response curve. Instead of plotting the intensity of the effect on the y-axis, we instead plot the percentage of the population that shows the desired effect. In this version, 50% response does not mean “half of the maximum effect possible.” Instead, it means “half of the population shows the desired effect.” A dose that produces a response in half the subjects is called, once again, the effective dose, 50% (ED50).
We can also plot toxic effects, such as lethality, on a similar graph. A lethal dose is similar to an effective dose, except the effect being measured is lethality. Similar to the effective dose, we can define the lethal dose, 50% (LD50) as the dose necessary to produce lethal effects in 50% of the population. If we are interested in a non-lethal toxic effect, we can use the term toxic dose, 50% (TD50) instead. A drug may have as many 50% doses as it has drug effects. Take a look at this graph showing effective and lethal doses for the drug phenobarbital:
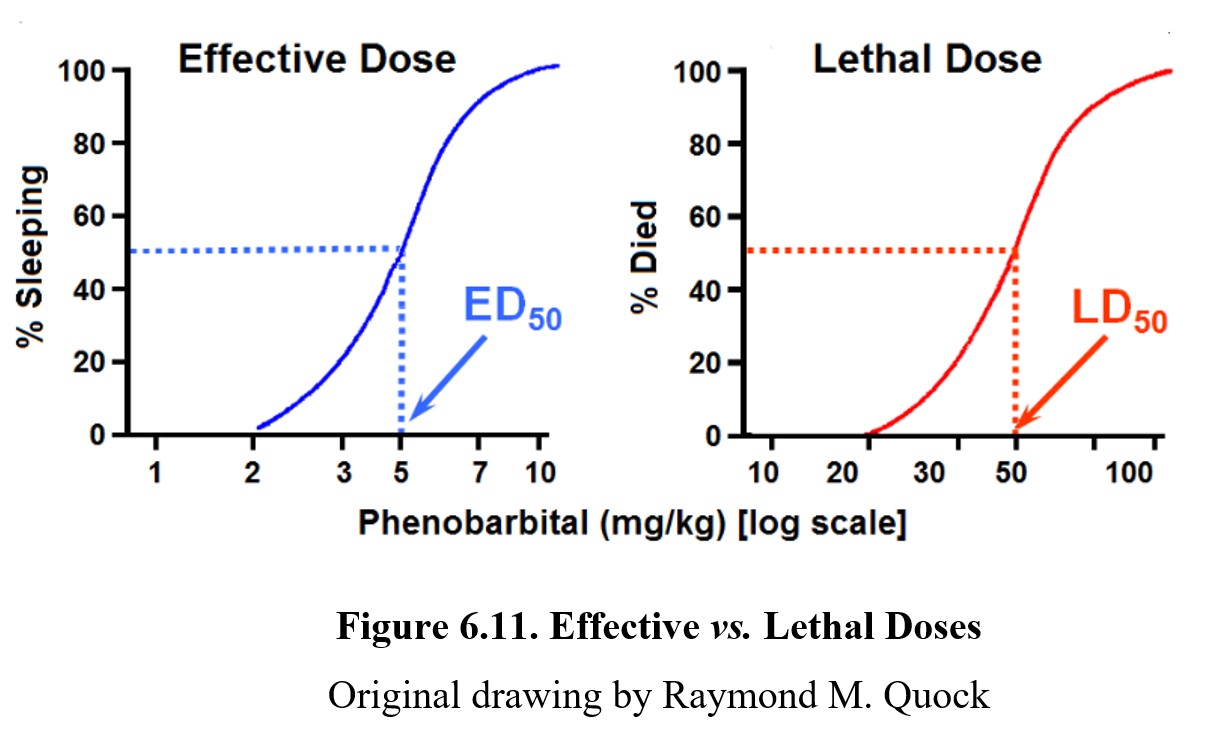
As shown by the dose-response graph on the left, at low doses, phenobarbital can produce therapeutic effects (in this case, sleeping). At high doses, the drug can lead to lethal effects such as respiratory failure as depicted by the graph on the right. For drugs to be therapeutic, the effective doses need to be smaller than the lethal doses. The distance between an effective dose and a lethal dose (or toxic dose) is very important in drug safety. The separation between the effective and toxic dose-response curves is called the therapeutic window, where the drug can produce therapeutic effects without eliciting toxic or lethal effects. It should be obvious from the dose-response curves below that Drug A is safer than Drug B because the effective and toxic doses do not overlap. That is clearly not the case with Drug B since the ED50 dose may produce some degree of toxicity.
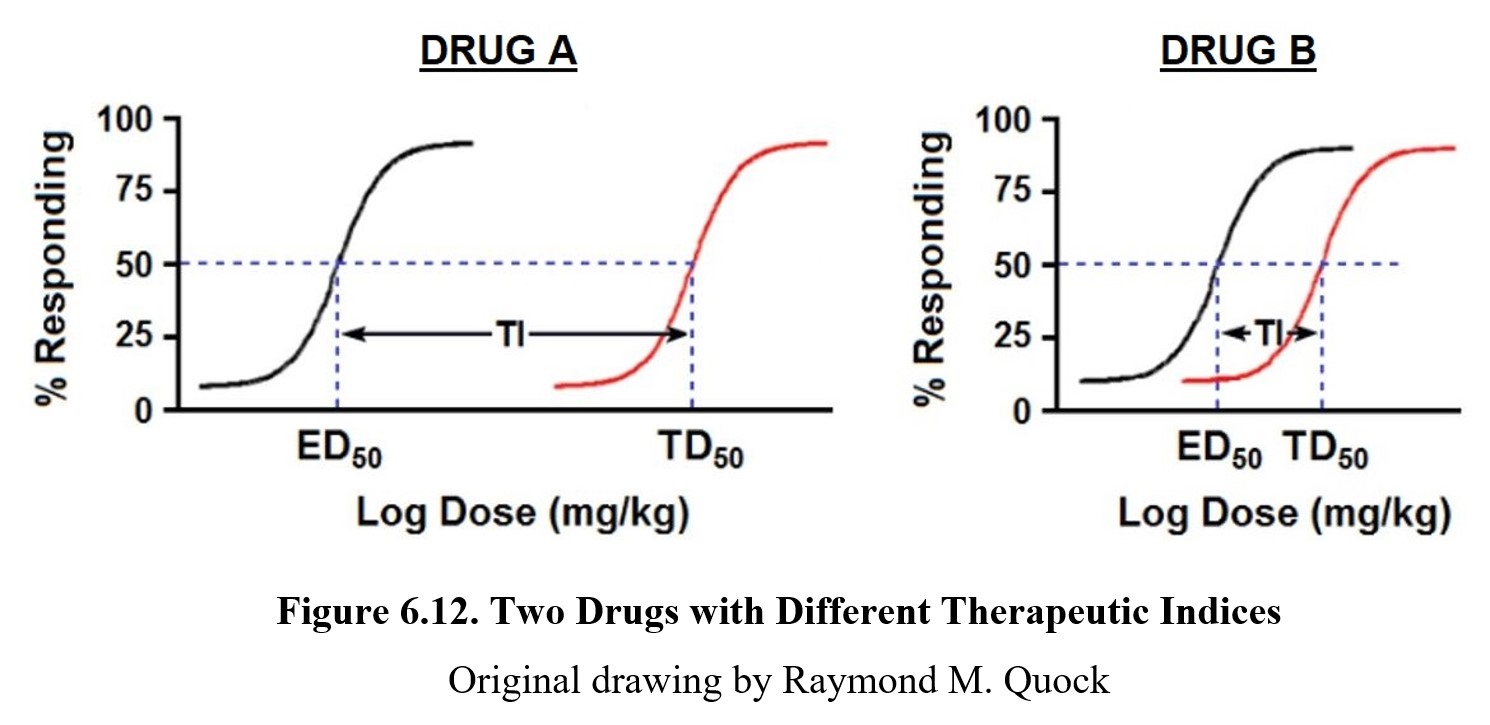
The formula for therapeutic index is TI = TD50/LD50 and is a measure of drug safety. Because Drug A has non-overlapping effective and toxic dose-response curves, it enjoys a large therapeutic window because clinically effective doses carry an extremely low risk of toxicity. On the other hand, the effective and toxic dose-response curves for Drug B show only a smaller separation, meaning the therapeutic window is much smaller. This difference is reflected in the Tis for both drugs. A higher TI means a greater separation between the two curves and thus a reduced chance of experiencing toxicity; a smaller TI means a greater danger of toxicity at therapeutic doses of the drug.
Although the therapeutic index is widely used, it is not a perfect measure of drug safety. The TI ignores the slopes of the dose-response curves, which may lead to two drugs with the same therapeutic index having very different levels of safety. For example:
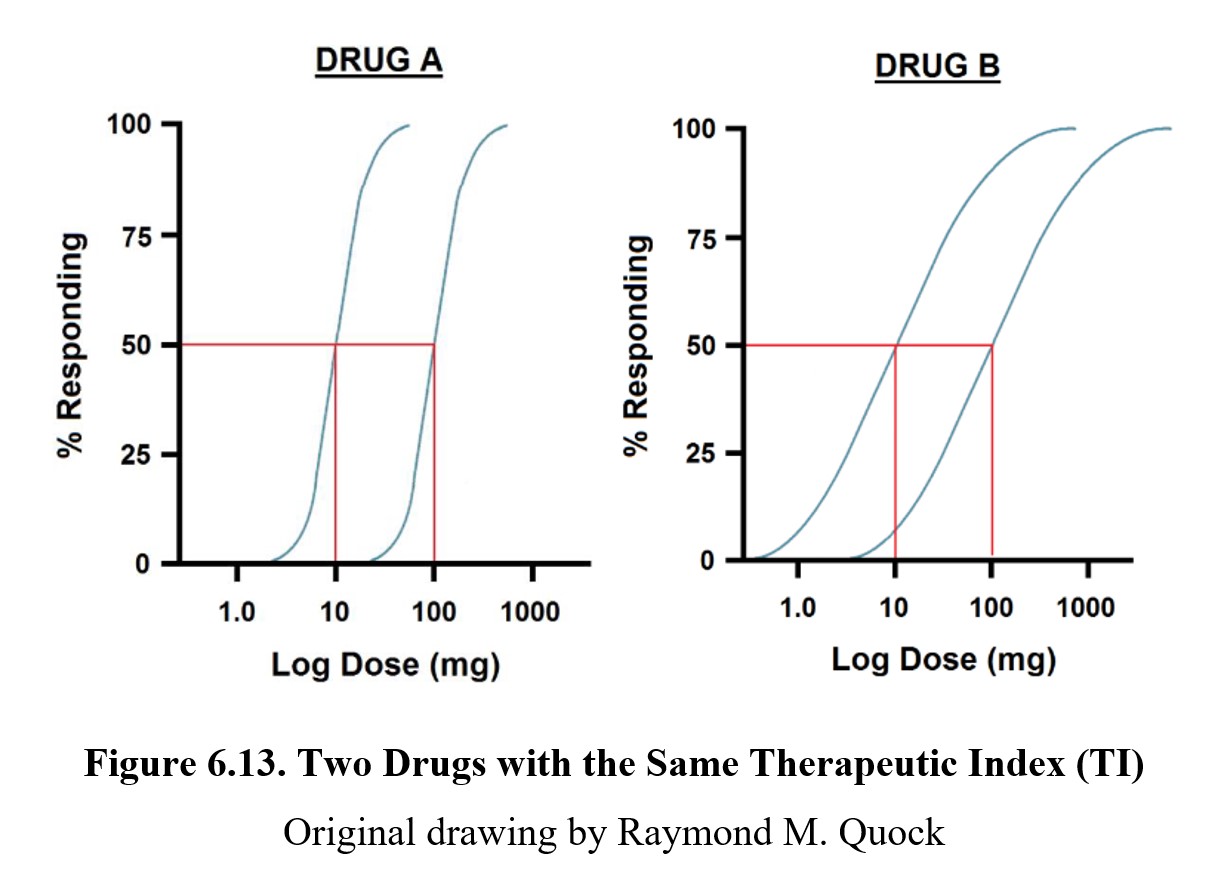
Although drugs A and B have the same therapeutic index, the curves for the therapeutic and toxic effects overlap much more in the case of the latter. By the time you reach a dose that is likely to produce the desired therapeutic effect, there is already a small chance that a toxic or lethal effect has occurred. Healthcare providers generally prescribe maximal or supramaximal therapeutic drug doses and never the ED50 dose which has a 50:50 likelihood of producing a therapeutic effect. Using TI will likely overestimate the safety of the medication in question.
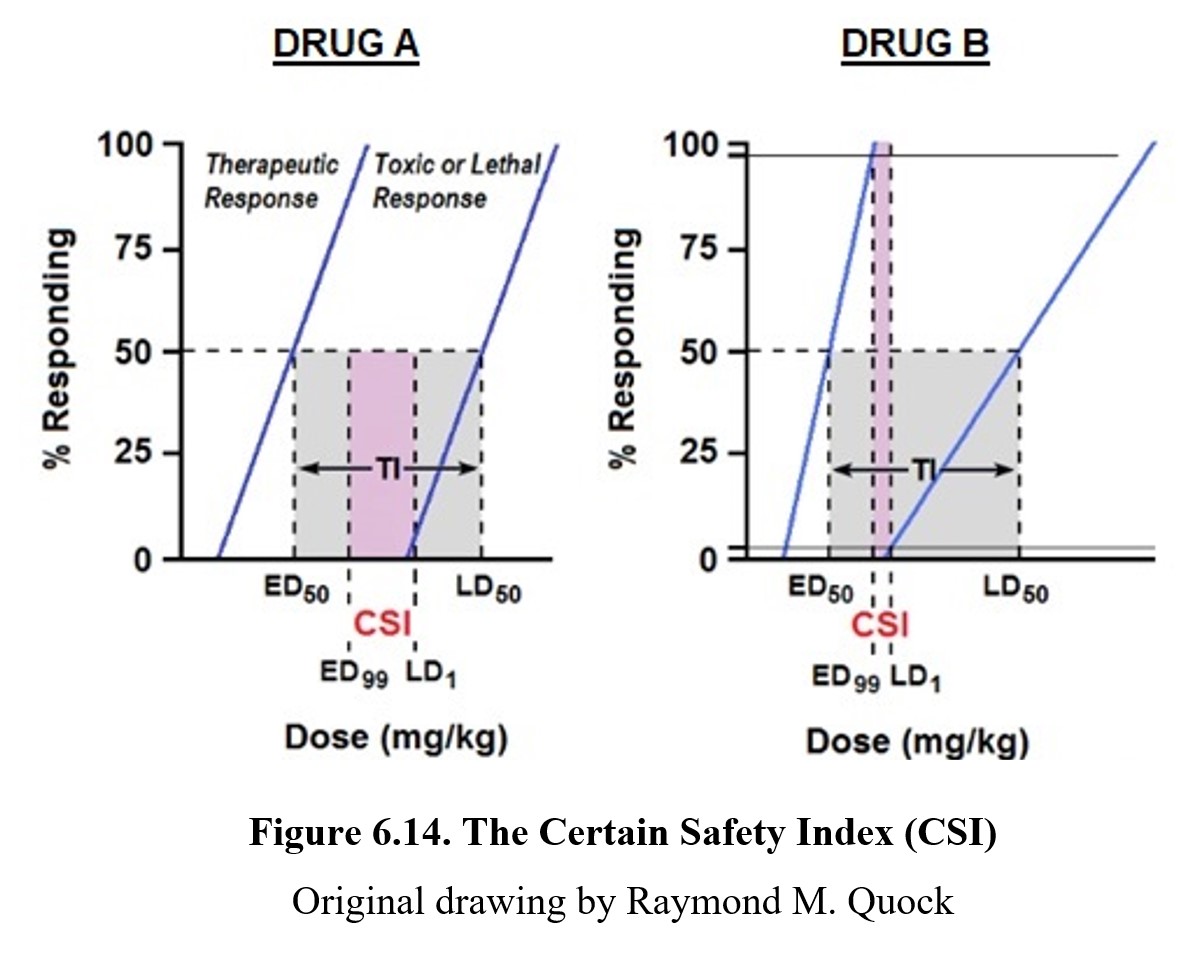
A better strategy for estimating drug safety would be to compare the dose required to a near-guaranteed therapeutic response (ED99) to the minimum dose for a toxic effect (TD1). This is the certain safety index (CSI); other names for this index are the certain safety factor (CSF) or margin of safety (MOS). Instead of dividing TD50 by ED50, the CSI divides TD1 by ED99. (As with the therapeutic index, the lethal dose can be used instead of the toxic dose.) You can see how this compares to the therapeutic index in the graphs above. In Fig. 6.14, it is evident that the CSI is much narrower than the TI. Therefore, CSI is a more conservative estimate of drug safety because it is the ratio of a lethal dose in 1% of the population to a safe therapeutic dose in 99% of the population. As is the case with TI, the greater the value of CSI, the safer the drug. In addition, it is more reasonable and realistic to use ED99 rather than ED50 as the therapeutic response because physicians are not likely to prescribe a drug dose that produces less than a maximal therapeutic effect.
Chapter Summary and Review
In this chapter, we finished up our coverage of pharmacology by examining pharmacodynamics, or what the drug does to the body. We explained how drugs can alter neurotransmission in different ways and how drugs can interact with each other. We also learned how to evaluate drug effects using dose-response curves as well as different ways to measure the safety of a drug. That is all for this chapter. Next, we will be moving on to the behavioral side of drug use. Make sure to check your understanding and reach out to your instructor if you have any questions.
Chapter 6 Practice Questions
Answer the following questions.
- How do drugs affect physiological function?
- Where are autoreceptors and heteroreceptors located, and where do the neurotransmitters that activate them come from?
- What are two important properties of drug agonists?
- Explain the difference between competitive and non-competitive antagonists.
- What are inverse agonists?
- What is an allosteric modulator?
- Name three different types of drugs that can indirectly change receptor activation.
- What are some possible causes for drug interactions? Provide a pharmacokinetic example and a pharmacodynamic one.
- Are all drug-response curves sigmoidal in shape?
- Differentiate between potency and efficacy on a dose-response curve.
- Define EC50, ED50, TD50, and LD50. What does the “50” stand for in each term?
- For any given drug, would you expect the therapeutic index or certain safety index to be higher? Why?
2nd edition
