Part 10: Accessibility for Technical Notation and Data Visualization
Materials that include technical notation and complex data visualization can pose particular challenges for accessibility. Digital humanities, science, technology, engineering, and math all have specialized notations and visualization strategies that must be made coherent for an assistive device. To address this concern, the following languages and tools are often used:
- Mathematical Markup Language (MathML): A markup language used to display mathematical notation on the web and in other formats like EPUB.
- MathJax: A set of open-source JavaScript libraries that enables display of MathML in various environments (such as Google Chrome, which otherwise lacks native support for MathML). MathJax can also accept two other markup languages, LaTeX and AsciiMath.
- Equation editors: Editors like MathType can generate MathML for use in particular environments. However, note that not all equation editors produce accessible notation. Do some research about the editor and the environment where you would like to use it before making selections. W3C provides a list of equation editors.
- Document transformers: These include the open-source transformer Pandoc, which can accept formats like LaTeX and Word and allows for direct integration with MathJax.
- Visual recognition software: Apps and tools like Mathpix Snip can be used to render handwritten or typed math into MathML, LaTeX, AsciiMath, and other notations.
Markup languages like MathML are important because they make notation machine-readable, thus translating an intricate visual medium for people using assistive devices. This video introduction to MathML and LaTeX demonstrates how this works in practice.
Machine readability is only one possible barrier to accessing STEM materials. Another common concern is how to render complex spatial and visual information into alternate forms. For instance, how would you verbally describe the following image?
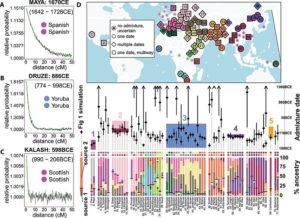
Garrett Hellenthal, George B.J. Busby, Gavin Band, James F. Wilson, Cristian Capelli, Daniel Falush, and Simon Myers. Overview of inferred admixture for 95 human populations. CC BY-SA 2.5.
For a diagram like this, someone may choose to write a long description that employs bullet points or even a table to spell out information more clearly (see the Diagram Center for more on this). Other solutions include rendering this image as sound or transforming it into a Scalable Vector Graphic (SVG) that provides interactivity for screen reader users.
Other notation/visualization accessibility challenges that you may encounter while managing an open initiative include:
- Mathematical and chemical notation may migrate poorly from one format to another—say, from LaTeX to PDF.
- Textual descriptions may not do justice to the spatial and visual representations in diagrams, images, or tables.
- Datasets may not be machine-readable and may, therefore, be inaccessible to screen readers.
Data/STEM accessibility often requires particular expertise that you may find at your campus access center or distance learning unit. This chapter is intended primarily to give you ideas about how you might think about accessibility for technical notation and data visualization, and where you might go to find more information and assistance.
