Learning Objectives
After reading this section, students should be able to …
- appreciate the importance of the economic environment
- understand the implication of inflation, deflation and balance of payments
The economic environment is important because of the rapid integration of international economic markets. Increasingly, businesses, consumers, and governments realize that their lives are affected not only by what goes on in their own town, state, or country but also by what is happening around the world. Consumers can walk into their local shops today and buy goods and services from all over the world. Local businesses must compete with these foreign products. However, many of these same businesses also have new opportunities to expand their markets by selling to a multitude of consumers in other countries. The advance of telecommunications is also rapidly reducing the cost of providing services internationally, while the Internet will assuredly change the nature of many products and services as it expands markets even further.
A nation’s economic situation represents its current and potential capacity to produce goods and services. The key to understanding market opportunities lies in the evaluation of the stage of a nation’s economic growth. Economic growth is the increase in the amount of the goods and services produced by an economy over time. It is conventionally measured as a percentage change in the Gross Domestic Product (GDP) or Gross National Product (GNP). These two measures, which are calculated slightly differently, total the amounts paid for the goods and services that a country produced. As an example of measuring economic growth, a country that creates 9,000,000 in goods and services in 2010 and then creates 9,090,000 in 2011 has a nominal economic growth rate of 1% for 2011.
In order to compare per capita economic growth among countries, the total sales of the countries to be compared may be quoted in a single currency. This requires converting the value of currencies of various countries into a selected currency, for example, U.S. dollars. One way to do this conversion is to rely on exchange rates among the currencies, for example, how many Mexican pesos buy a single U.S. dollar? Another approach is to use the purchasing power parity method. This method is based on how much consumers must pay for the same “basket of goods” in each country.
Inflation or deflation can make it difficult to measure economic growth. If GDP, for example, goes up in a country by 1% in a year, was this due solely to rising prices (inflation) or because more goods and services were produced and saved? To express real growth rather than changes in prices for the same goods, statistics on economic growth are often adjusted for inflation or deflation.
For example, a table may show changes in GDP in the period 1990 to 2000, as expressed in 1990 U.S. dollars. This means that the single currency being used is the U.S. dollar, with the purchasing power it had in the U.S. in 1990. The table might mention whether the figures are “inflation-adjusted” or real. If no adjustments were made for inflation, the table might make no mention of inflation-adjustment or might mention that the prices are nominal.
A country’s balance of payments is a record of its economic transactions with the rest of the world; this record shows whether a country has a trade surplus (value of exports exceeds the value of imports) or a trade deficit (value of imports exceeds the value of exports). Trade figures can be further divided into merchandise trade and services trade accounts; a country can run a surplus in both accounts, a deficit in both accounts, or a combination of the two. The U.S. merchandise trade deficit was $819 billion in 2007. However, the U.S.enjoys an annual service trade surplus. Overall, however, the United States is a debtor; Japan enjoys an overall trade surplus and serves as a creditor nation.
Student Example
The United States has been running on a trade deficit since 1976 because of high imports of consumer products and oil. It’s very easy for an American citizen to go into any store and find a product that was not manufactured in the United States. When I go shopping for clothes, I always see tags stating, “Made in Vietnam/China/India/Taiwan/Indonesia.” I don’t think I have ever seen a clothing item with a tag stating, “Made in the U.S.A.” The same could be said about other products, such as furniture, vehicles, and electronics. One of the main reasons why the United States is running on a trade deficit is because most companies in the United States make their products abroad due to cheaper labor and import them into the United States to sell them. One of the biggest ways a trade deficit can affect the economy is through employment. If imports have a higher demand than exports, domestic jobs could be lost abroad, which could lead to increased unemployment rates.
Ivan Chavez
Class of 2020
Let’s look at the growth of exports in the world during the past fifty or more years. Figure 4.1 “World Exports, 1948–2008 (in Billions of U.S. Dollars)” shows the overall annual exports measured in billions of U.S. dollars from 1948 to 2008. Recognizing that one country’s exports are another country’s imports, one can see the exponential growth in outflows and inflows during the past fifty years.
Figure 4.1 World Exports, 1948–2008 (in Billions of U.S. Dollars)
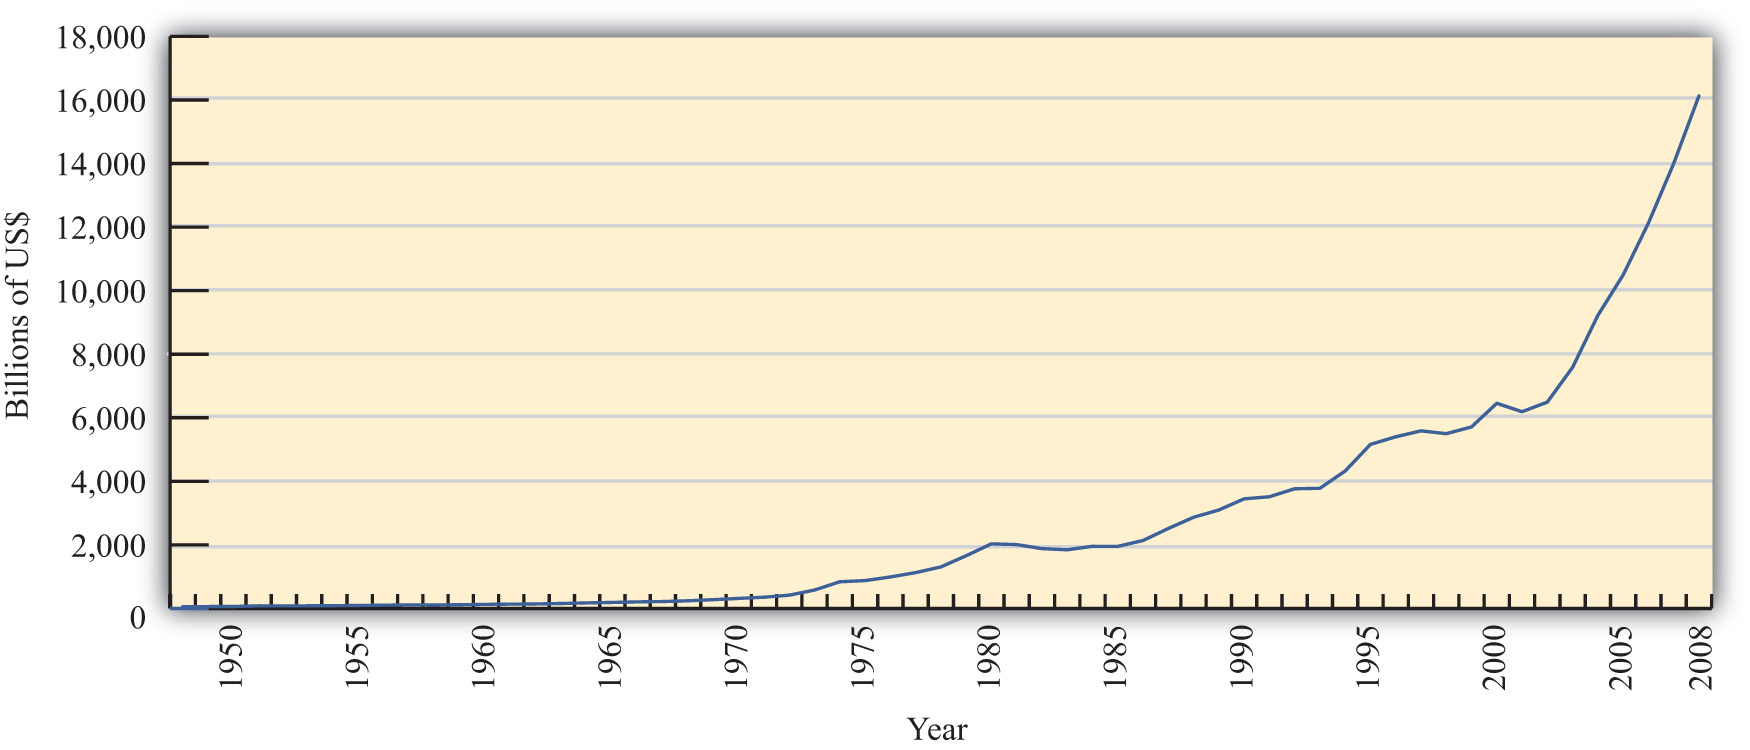
Source: World Trade Organization, International trade and tariff data, http://www.wto.org/english/res_e/statis_e/statis_e.htm.
However, rapid growth in the value of exports does not necessarily indicate that trade is becoming more important. A better method is to look at the share of traded goods in relation to the size of the world economy. Figure 4.2 “World Exports, 1970–2008 (Percentage of World GDP)” shows world exports as a percentage of the world gross domestic product (GDP) for the years 1970 to 2008. It shows a steady increase in trade as a share of the size of the world economy. World exports grew from just over 10 percent of the GDP in 1970 to over 30 percent by 2008. Thus trade is not only rising rapidly in absolute terms; it is becoming relatively more important too.
Figure 4.2 World Exports, 1970–2008 (Percentage of World GDP)
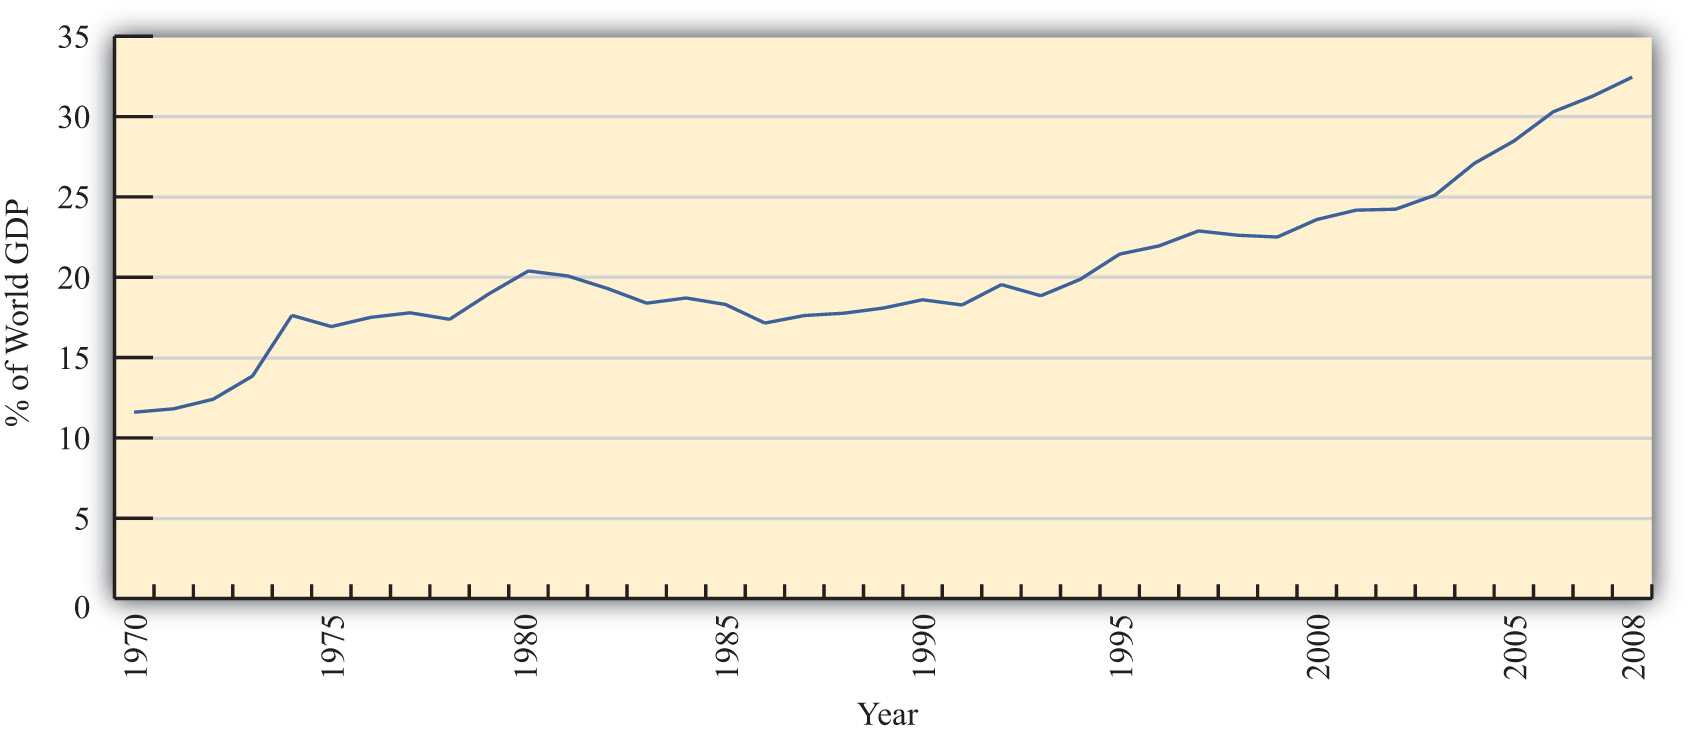
Source: IMF World Economic Outlook Database, http://www.imf.org/external/pubs/ft/weo/2009/02/weodata/index.aspx.
One other indicator of world interconnectedness can be seen in changes in the amount of foreign direct investment (FDI). FDI is foreign ownership of productive activities and thus is another way in which foreign economic influence can affect a country. Figure 4.3 “World Inward FDI Stocks, 1980–2007 (Percentage of World GDP)” shows the stock, or the sum total value, of FDI around the world taken as a percentage of the world GDP between 1980 and 2007. It gives an indication of the importance of foreign ownership and influence around the world. As can be seen, the share of FDI has grown dramatically from around 5 percent of the world GDP in 1980 to over 25 percent of the GDP just twenty-five years later.
Figure 4.3 World Inward FDI Stocks, 1980–2007 (Percentage of World GDP)
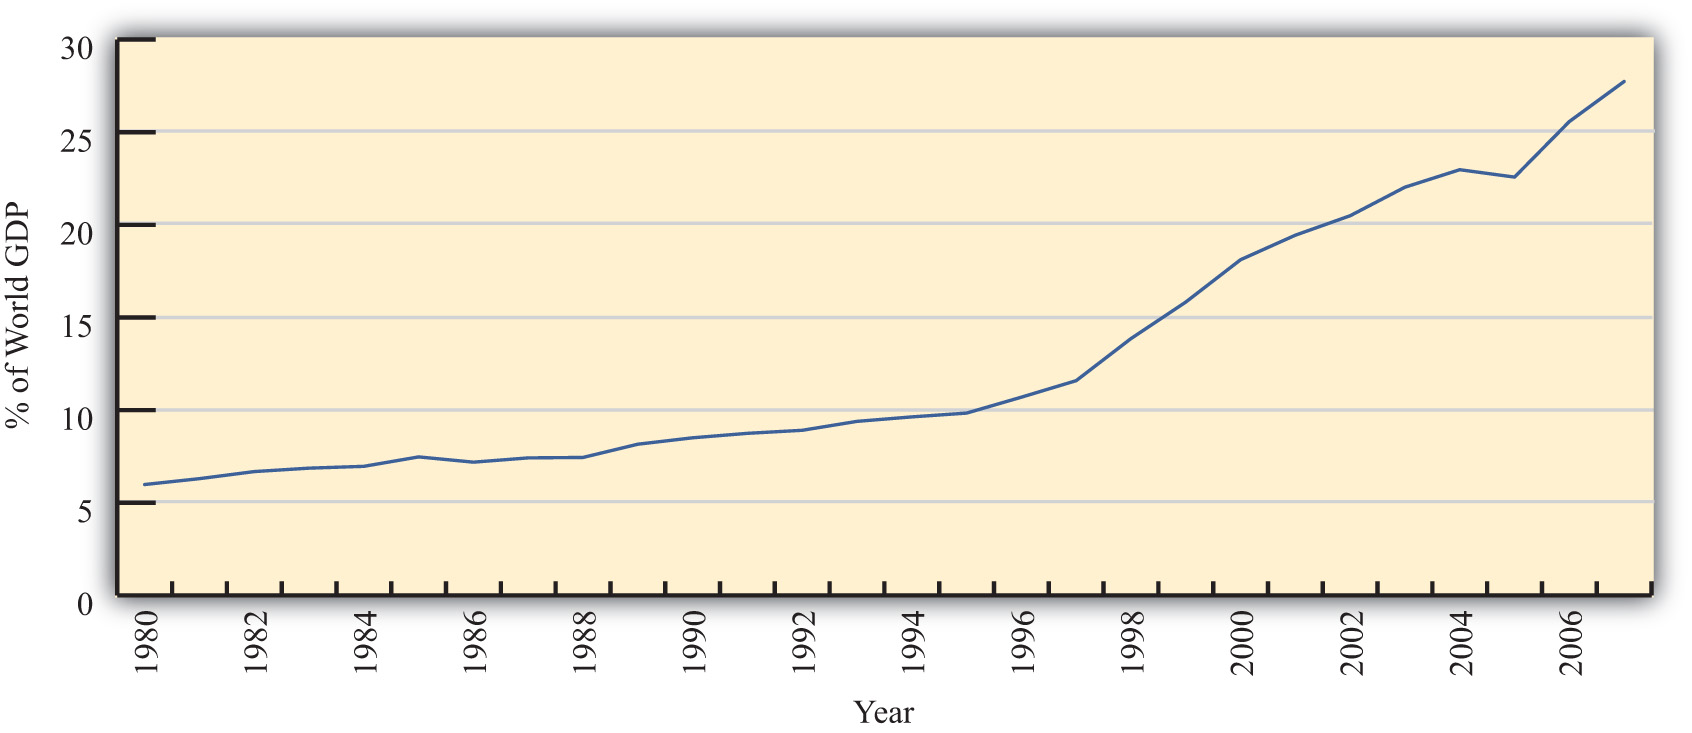
Source: IMF World Economic Outlook Database, http://www.imf.org/external/pubs/ft/weo/2009/02/weodata/index.aspx; UNCTAD, FDI Statistics: Division on Investment and Enterprise, http://www.unctad.org/Templates/Page.asp?intItemID=4979&lang=1.
The growth of international trade and investment has been stimulated partly by the steady decline of trade barriers since the Great Depression of the 1930s. In the post–World War II era, the General Agreement on Tariffs and Trade, or GATT, prompted regular negotiations among a growing body of members to reciprocally reduce tariffs (import taxes) on imported goods. During each of these regular negotiations (eight of these rounds was completed between 1948 and 1994), countries promised to reduce their tariffs on imports in exchange for concessions—that means tariffs reductions—by other GATT members. When the Uruguay Round, the most recently completed round, was finalized in 1994, the member countries succeeded in extending the agreement to include liberalization promises in a much larger sphere of influence. Now countries not only would lower tariffs on goods trade but also would begin to liberalize the agriculture and services markets. They would eliminate the many quota systems—like the multifiber agreement in clothing—that had sprouted up in previous decades. And they would agree to adhere to certain minimum standards to protect intellectual property rights such as patents, trademarks, and copyrights. The World Trade Organization (WTO) was created to manage this system of new agreements, to provide a forum for regular discussion of trade matters, and to implement a well-defined process for settling trade disputes that might arise among countries.
Foreign exchange provides a means for settling accounts across borders. The dynamics of international finance can have a significant impact on a nation’s economy as well as the fortunes of individual companies. Currencies can be subject to devaluation or revaluation as a result of actions taken by a country’s central banker. Currency trading by international speculators can also lead to devaluation. When a country’s economy is strong or when demand for its goods is high, its currency tends to appreciate in value. When currency values fluctuate, global firms face various types of economic exposure. Firms can manage exchange rate exposure by hedging.
