Module Overview
In Module 13, we will discuss how to go about evaluating your plan, or a client’s, to see if it is working and if any changes are needed.
Module Outline
- 13.1. Evaluating Your Plan
- 13.2. Adjusting the Plan
Module Learning Outcomes
- Describe general strategies for evaluating your plan.
- Identify statistics to summarize your data.
- Construct a line graph to plot your data.
- Discuss ways to adjust your plan.
13.1. Evaluating Your Plan
Section Learning Objectives
- Clarify what to do if you have to change your target behavior.
- Name and discuss other situations that may necessitate adjusting your plan.
- List ways to numerically show your plan’s progress.
- Describe how to graph your data.
13.1.1. Changing the Target Behavior
As you are going through your plan it is a good idea to see how you are doing. Fortunately, you are collecting a great deal of data and have all you need to make a determination. Though I sincerely hope this does not occur, an issue you might discover right away, or within a week or so, is that you selected the wrong target behavior. You might be wondering how you could possibly make such a mistake. Maybe you are trying to increase the amount you work out but as you go through your plan you discover that you do regularly work out. Now you could add a day or work out longer possibly, but your issue is not having enough motivation to work out. The reason why your weight loss endeavor is not going anywhere is because you have crappy eating habits. I fall in this boat as I love going to the gym but fail to lose weight because I do not eat as healthy as I should. My biggest problem is portion sizes and so a behavior modification plan to work out more really does not benefit my actual long-term goals. I would need strategies linked to monitoring my caloric intake daily. I might also notice that stress and sleep are problems and change both to help with weight loss. Again, about a week into my plan I may realize that the target behavior needs to change which could result in creating a brand-new plan and quickly, as well as establishing a new baseline.
13.1.2. “Seeing” Your Progress
For most of you, changes as extreme as developing a brand spanking new plan will not be needed, but you may not feel you are making progress either. It’s likely more an issue of not making progress as quickly as we would like, but progress is being made. How can you tell?
13.1.2.1. Strategy 1: Weekly counts. You can use a few different strategies, or all of them, but the first thing you should do is get a count for each week of the treatment phase. How so? If you are trying to increase your water consumption, you might have recorded the following data for your first two weeks of the plan:
Table 13.1. Example Weekly Counts Log
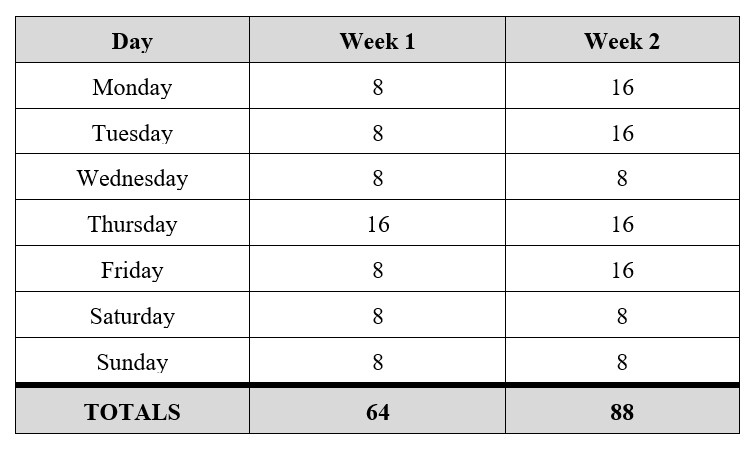
Say your Week 1 goal was to drink at least 8 oz. of water each day and your Week 2 goal was to drink at minimum 16 oz. of water each day. As you can see, you did well in Week 1 but not as well in Week 2. We can see this from just eyeballing the data, but how much water did we actually drink each week? Our Week 1 Total is 64 oz. and our Week 2 Total is 88 oz. By simply counting the total amount drank each week (through simple addition), we can see a trend in the upward direction.
13.1.2.2. Strategy 2: Daily average. We could also calculate an average or mean of total water drank each day. To do this, take the total and divide it by 7 days. Upon doing this we see that the Week 1 average is 9.14 oz., and the Week 2 average is 12.57 oz. The advantage of the average is that daily fluctuations are not as apparent, especially for Week 2, and the data smooths out.
13.1.2.3. Strategy 3: Percentage of opportunities. We could also calculate a percentage of opportunities to gauge our success for the week. In this case, we would want to divide the total amount of water drank for the week by the total amount of water that could have been consumed. Based on our goals, we know we were shooting for 8oz. of water a day for 7 days in Week 1, or 56 total ounces, and in Week 2, we should have drunk 112 oz. (16oz. x 7 days). Since we drank 64 oz. in Week 1, we were at 114% success rate while in Week 2 we drank 88 oz. which was a 78.57% success. Visual inspection of the data again shows us achieving our goal each day in Week 1, and even exceeding on Thursday, while in Week 2 we drank the required 16 oz. on four days and half that for three days. Something went wrong in Week 2 and by going back and evaluating our data for Wednesday, Saturday, and Sunday, we can figure out what we did wrong. Maybe we found that on Wednesday, we left our water bottle home and so drank less as a result. Once home we drank a glass of water but did not want to drink 2 since it was close to bedtime. On Saturday and Sunday, we noticed that we were out with friends a lot and did not have a water bottle with us, and also drank soda or tea instead. Armed with this information, we can adjust our plan by using antecedent manipulations; we could set our phone to give us a reminder (a cue for the desirable behavior), place a water bottle in the car in case we run out (reducing the effort for making the desirable behavior), take a water bottle to the gym with us when we work out (an establishing operation), have a friend remind us to drink water (social support and a verbal prompt), and develop a plan for dealing with the temptation to drink soda or tea when out with friends.
13.1.2.4. Strategy 4: Counting behaviors. As a note, you can also count the number of behaviors that were made. Your behavioral definition likely was 1 behavior = drinking 8 oz. of water. As such, in Week 1 you made 8 total behaviors and in Week 2 you made 11 behaviors. The trend is upward but should have been 7 behaviors in Week 1 to 14 in Week 2. The extra behavior in Week 1 makes the gap narrower but still, we were not as successful as we should have been in Week 2. Outside of the strategies mentioned above, you might also revisit your criterion. Maybe we should have held at 8 oz. for two weeks before moving from Goal 1 to Goal 2.
13.1.2.5. Strategy 5: Counting and graphing tokens earned. Another option is to find out how many tokens you earned from one week to the next. If you are making the desired behavior you should see an increase from week to week, but in the case of our example, Week 1 likely had a good number of tokens but Week 2 had not as many as it should have, and you may only have been slightly above the Week 1 total if you are using response costs for engaging in the undesirable behavior of drinking soda or tea.
13.1.2.6. Summary of descriptive statistics to use. So, in all, you can determine how your plan is doing by:
- Weekly counts – How many ounces drank, how many days worked out, how many pages read, etc. See Section 13.1.2.1.
- Computing the daily average – Divide total for the week (calculated in #1) by 7. See Section 13.1.2.2.
- Percentage of opportunities – What you did divided by how many times you could have done it. See Section 13.1.2.3.
- Counting the number of behaviors – Using your behavioral definition. See Section 13.1.2.4.
- Determining how many tokens you earned – Examining your token economy and the tables you developed for how many tokens earned for making the desired behavior each week. See Section 13.1.2.5. You can also graph this information. More on this in a bit.
These strategies to numerically summarize your data do not work for all behaviors. Determine which ones you need based on what your target behavior is and how you operationally defined it. Look at your goals and token economy too. Lastly, be sure you examine your journal each day. As I noted earlier, you may be showing progress, but not as fast as you would like. That is the case in the example I gave and analyzing why you did not meet your goal some days can identify problems with your plan, temptations you did not account for, or mistakes requiring new or clearer rules.
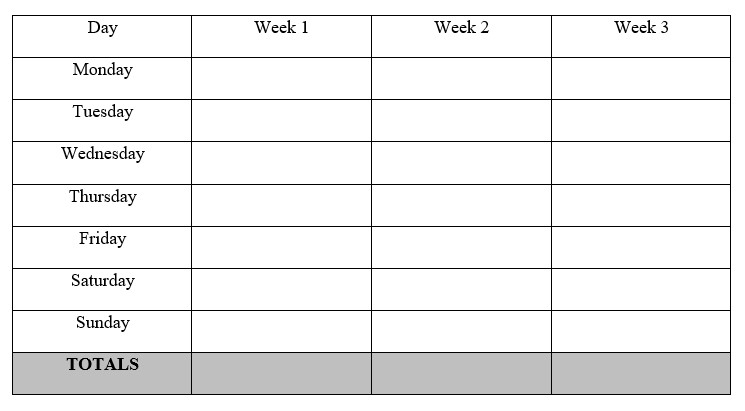
13.1.2.7. Treatment phase summary table. As during the baseline phase, you will also want to summarize your ABC charts which pools the data from the individual ABC charts for each day into one place. Record how much of the behavior you made on this table, not behavioral counts. You can conduct all analyses using this table.
Table 13.2. Treatment Phase Summary Table
13.1.3.1. Target behavior graph. One final way to evaluate your data is to graph it. You can do this for the behavior (whether totals, counts, averages, or a percentage), and for your token economy. To graph, you need to do the following:
- Draw a horizontal line on your paper. This is the x-axis and you will record time on it. This could be on days or weeks, depending on how your project is set up. If weeks, you will have three tic marks. If days, you will have 21 tic marks for the three weeks of the treatment phase. Behaviors such as drinking water or achieving daily goals are best measured in days on the x-axis but if you are trying to increase the duration of workouts from week-to-week, you are best measuring in weeks. Why? If you measure days you will have some with 0 and others with the amount of time you worked out. This will look like you failed on some days and not on others, when all the 0 really means is that you did not work out that day and were likely not scheduled to do so. You will also include baseline data on the x-axis. More on this in #5.
- Draw a vertical line that begins at the zero point of the x-axis, or is perpendicular with it. This is the y-axis and you will record your behavior on it, depending on whether you are using totals, counts, averages, or a percentage. In the case of working out, if you are trying to increase the number of days, or frequency, of the target behavior of working out, record counts or the number of days each week that you worked out. If you are trying to increase the time, you can record the average time each week, in minutes.
- Plot your data on the graph.
- Connect dots from time point to time point. If your plan is generally a success, you will see an upward trend.
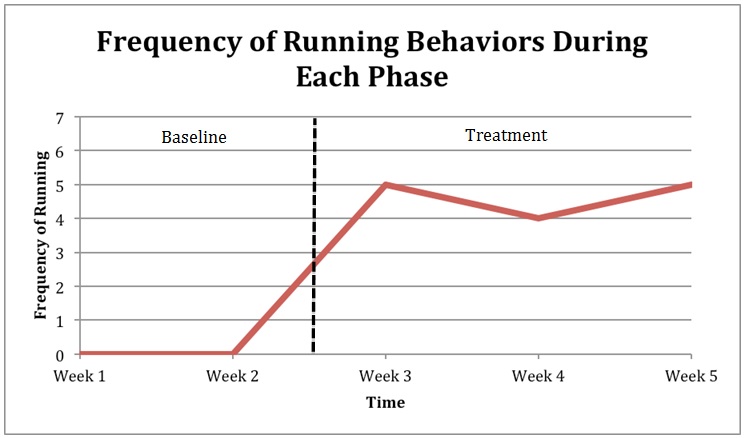
- On this graph you should also plot your baseline data (the two weeks or 14 days of data you collected when doing your functional assessment and practicing your data collection). This will go before the treatment weeks and serve as a comparison. So you are not only looking for an upward trend from week-to-week during treatment, but overall, you should see an upward trend from baseline to treatment phase.
- Your baseline to treatment transition should be indicated by a vertical dotted line in the graph itself.
- You should also use phase labels at the top of the graph – one for Baseline and a second for Treatment.
A sample line graph is given below. Note that it is best to create this graph in Microsoft Excel. Though there is a way to create the phase line and labels in Excel, it may be best to:
- Take a screen shot of your finished graph
- Move it to Microsoft PowerPoint.
- Create the line and labels in PPT.
- Once done, be sure to group the entire finished graph with phase labels and the line.
- Copy and paste into your final paper in the appropriate Appendix.
Figure 13.1. Example Line Graph
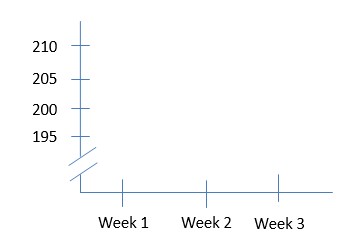
Sometimes, it is not necessary to start at ‘0’ on the vertical axis such as in the case of plotting your weight across time. In this case, break the line which indicates you are not starting at ‘0.’ This will appear as follows:
Figure 13.2. Example Y-Axis When It Does Not Start at ‘0’
13.1.3.2. Tokens graph. You can produce a graph for your behavior but also your token economy results. In this case, there is no baseline data to report since you did not use the token economy at this time, and so the phase line and labels are not needed. This will look like a standard graph and if your plan was generally successful, the line should slope upward from Treatment Phase Week 1 to 3.
13.2. Adjusting the Plan
Section Learning Objectives
- Generate solutions to common problems with a behavior modification plan.
- Clarify what the next steps are.
13.2.1. Common Problems and Possible Solutions
If you are at the point of needing to adjust your plan, you need to figure out what is making your plan difficult to achieve. Likely, you will have at least one issue with your antecedents, behavior, and/or consequences. Look closely at the data you gathered and your notes in the journal. Do you see a pattern? Is there a temptation you did not account for? Are you not keeping good enough records? With this in mind, let’s discuss some common issues that can be fixed (we discussed some of these in 13.1.):
- Unrealistic Goals – Maybe your goals are just not realistic. Your distal goal may be fine, but your proximal goals along the way are too large leading to failure, or too small, leading to frustration. If too large, create more goals that are smaller and easier to achieve. Instead of going from working out 2 days to 4 days, workout 2, then 3, and then 4 days. Instead of increasing your speed on the treadmill from 5.5mph to 6pm in a matter of weeks, take baby steps and increase by 0.1 mph each week. For water consumption, move from 8 oz. to 12 oz. instead of 8 oz. to 16 oz. This subtle change may make all the difference.
- Faulty Criterion – It is possible your goals are fine, but your criterion has you moving to the next goal too soon after the previous one is achieved. Instead of moving to 3 days working out from 2 days after just one week achieving this, increase your criterion to maintaining the current level for 2 weeks. Likewise, you may have too large of a criterion such that you are holding fast for 2 weeks when you can advance after just one week. It might be for the lower goals you can have a 1-week criterion but as you get to upper tier goals nearing your final goal, you increase the criterion to 2 weeks. This is especially important with any type of workout goal. You don’t want to risk injury so play it safe, without being so safe you become bored. Consult a trainer or your physician if you are unsure when it is safe to move up and avoiding plateauing.
- Record Keeping Issues – If your method of record keeping does not work for you, find another way. If you cannot remember to record, ask a friend or loved one to help. Use your phone to give you reminders. It could be that you are recording, but not making quality entries in your journal or ABC chart. If this is the case, then be sure you allow yourself enough time to reflect on your target behavior for the day. You might discover that a great time to do this is while you are on the bus going home from school or right after dinner. Make any adjustments you think are necessary.
- Problems with Strategies – If a strategy is not working, either try and adjust how you are using it or just drop it. Maybe an antecedent manipulation is not working out such as in the earlier example of leaving your clothes by your bed. Because you wake up before the sun rises you don’t see anything until you enter the bathroom. Move your clothes to the bathroom so they adequately cue you, or remind you, to work out. Make sure your prompts are helpful, your token economy awards tokens at a steady rate and that your back up reinforcers are not too high priced or too inexpensive, you are using the correct type of differential reinforcement, and you are not either underusing or overusing punishment procedures. If you are unsure if you should change a strategy, consult your instructor.
- Unrecognized Temptations – We may be unaware of a temptation that causes us to engage in the undesirable behavior or another situation or place that leads to the temptation. If you discover one, develop an if-then plan to deal with it.
- Inadequate or Unclear Rules – It could be your rules need work too. Look over each rule that you wrote and see if adjustments are needed.
- Social Support isn’t Really Supportive – Maybe your problem is the people who are supposed to be delivering reinforcers and prompts to keep you on task. If this is so, talk to them about why they seem to be undermining your success and figure out a better path going forward. It could be that they do not like the “new you” and are punishing your attempts to engage in positive change. You may need to avoid these people while you are implementing your behavior modification plan.
Of course, there can be countless other issues that you may encounter. Identify anything you believe could be hindering your success so it can be adjusted for.
13.2.2. Next Steps
Once you have figured out needed changes to your plan, implement them. Continue the process of evaluation and adjustment until your plan works or you just cannot seem to reduce the unwanted behavior or increase a desirable one.
Assuming your plan works, and the behavior has changed in the hypothesized manner, you will proceed to the maintenance phase.
Module Recap
Module 13 discussed the important issue of evaluating your plan and making adjustments as needed. We discussed hypothetical situations and what you could do about them, and methods to numerically summarize your data. We also discussed how to graph your data to generate a visual representation of its progression.
Our final module will tackle the maintenance phase and relapse prevention.
4th edition
