63 7.3 ETHNICITIES IN THE UNITED STATES
The distribution of ethnicities in the United States follows patterns that have been in place for some time. Historic migrations (some of which were forced) produced the patterns we still see in the United States.
7.3.1 African Americans in the United States
African Americans in the United States are still heavily southern. Their distribution (Figure 7.3) dates to the beginning of the United States and the forced importation of millions of Africans. Starting in the early twentieth century, many African Americans migrated out of this region, but most did not. In the last decades of the twentieth century and the beginning of the twenty-first, there has even been a reverse migration of African Americans back to Southern cities and suburbs.
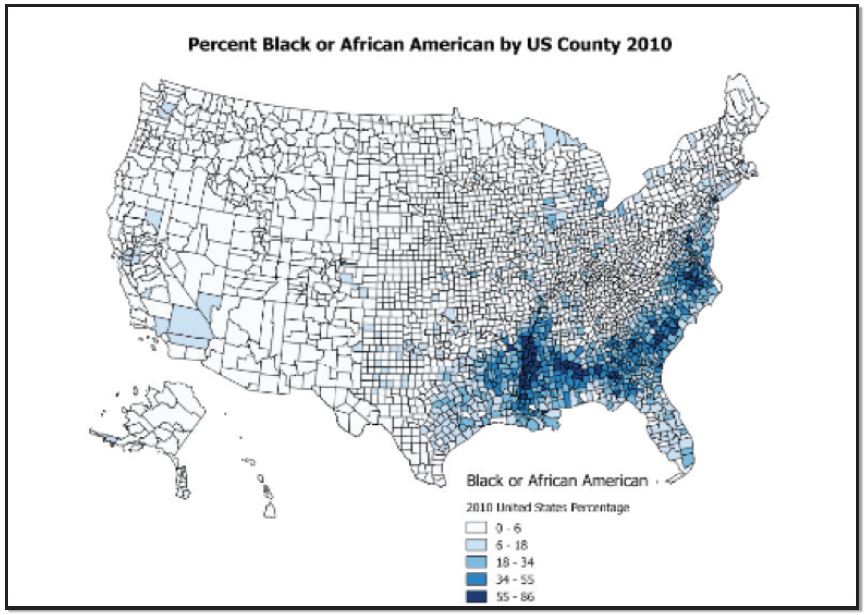
Figure 7.3 | The Distribution of the African American Population 3
Author | David Dorrell
Source | Original Work
License | CC BY SA 4.0
7.3.2 Hispanics in the United States
Many of the states with large Hispanic populations were states taken from Mexico by the United States in the Mexican American War. In some ways, these places didn’t come to the United States, the United States came to them. Certainly, a pattern is apparent. Generally, the parts of the U.S. closest to Mexico or the Caribbean are the most Hispanic (Figure 7.4). There are other areas with high Hispanic populations. These places have been attractive to immigrants for their employment prospects.
7.3.3 Asian Americans in the United States
sian Americans also have a distinctive distribution based in history. The western United States, and in particular, Hawaii, are physically the parts of the United States that are closest to Asia. A proximity effect similar to that of Hispanics is in play here. Figure 7.5 shows their distribution.
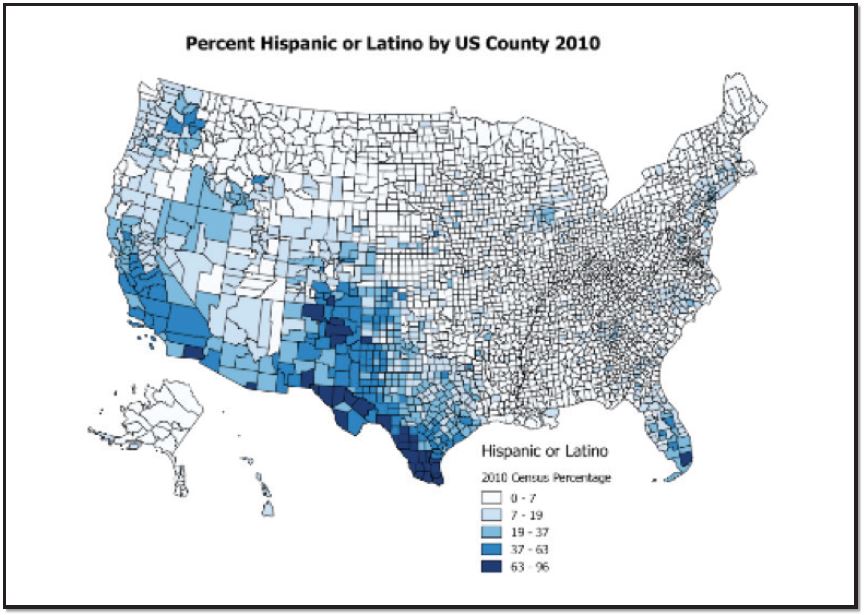
Figure 7.4 | The Distribution of the Hispanic Population 4
Author | David Dorrell
Source | Original Work
License | CC BY SA 4.0
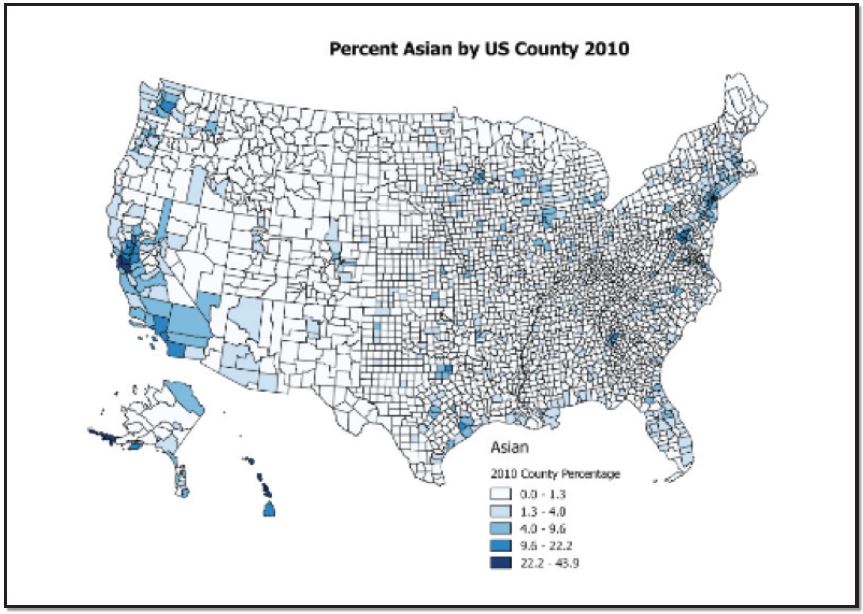
Figure 7.5 | The Distribution of the Asian American Population 5
Author | David Dorrell
Source | Original Work
License | CC BY SA 4.0
7.3.4 American Indian and Alaska Natives
At one time, all of the current territory was occupied by Native Americans. Due to the influence of disease, genocidal wars, and poverty they have been reduced to roughly 2 percent of the overall population of the United States. Some live on reservations, but most do not (Figure 7.6).
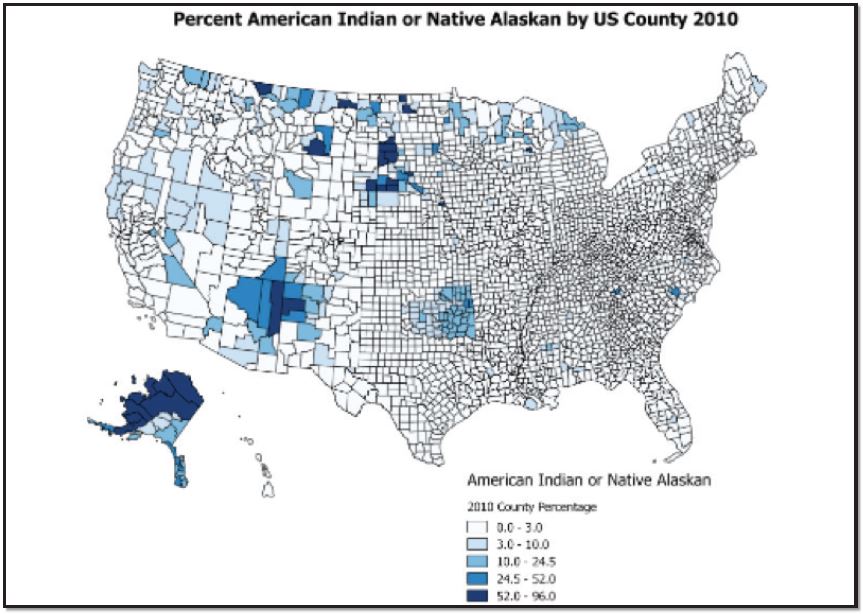
Figure 7.6 | The Distribution of the American Indian Population 6
Author | David Dorrell
Source | Original Work
License | CC BY SA 4.0
7.3.5 Native Hawaiian and Other Pacific Islander
Hawaii at one time had been an independent kingdom. Other territories in the Pacific were taken during wars with other dominant regional powers. Many of these groups have migrated to the mainland of the United States (Figure 7.7). In the same way that American Indians are a minority in every state, Native Hawaiians are a minority in Hawaii.
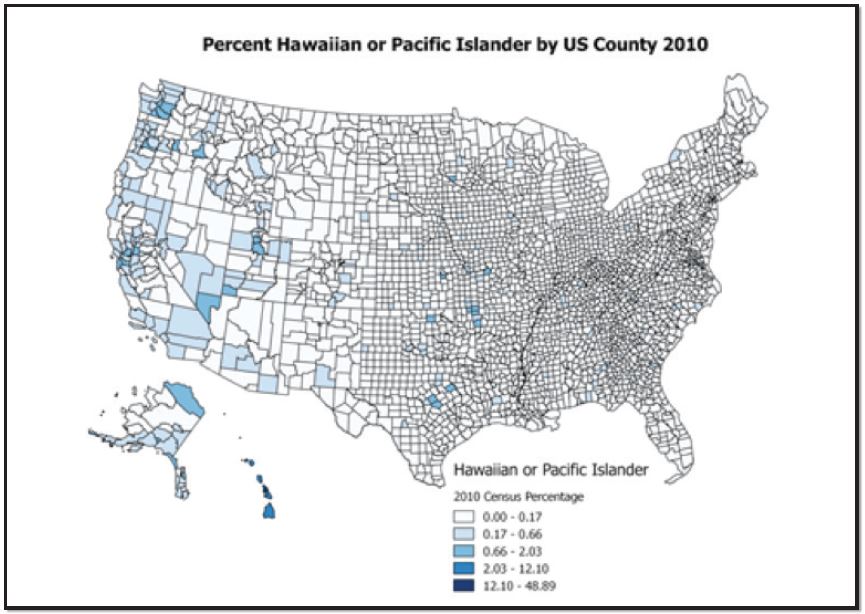
Figure 7.7 | The Distribution of the Native Hawaiian or Pacific Islander Population 7
Author | David Dorrell
Source | Original Work
License | CC BY SA 4.0
